
Abstract
Keywords
Introduction
Faults are the main channels for vertical migration of hydrocarbons in faulted basins (Hindle, 1997; Jiang et al., 2018). Transport within faults is likely to be important where there is a large stratigraphic separation between the source and reservoir intervals (Jiang et al., 2015). The evaluation of fault activity plays an important role in the study of fault transport, because active and/or critically stressed faults may serve as fluid migration pathways while quiescent faults are more likely to be sealing (Hindle, 1997; Townend and Zoback, 2000). Hence, the rate of fault displacement and the duration of fault activity with the respect to the hydrocarbon charge history are important concepts for studying the effect of fault transport on hydrocarbon migration. Faults may act as important fluid conduits if the period of fault activity coincides with expulsion and secondary migration of hydrocarbons away from the source rock interval (Jiang et al., 2017). Using the effective fault transport as the clue to determine the migration pathways is helpful to reduce exploration risks.
The Baxian Depression is an important oil-rich depression in the Bohai Bay Basin. The hydrocarbons sourced from the Paleogene mudstones were accumulated in multiple stratigraphic levels, and the main oil-bearing series include (in stratigraphic order) the Paleogene Shahejie (E2s4, E2s3, E2s2 and E2s1) and Dongying (E3d) formations, and the Neogene Guantao (Ng) Formation (Zhao et al., 2015). Most of the oils in these strata are distributed near faults. These features indicate that hydrocarbons have migrated vertically and that faults played an important role in the process. Some research has been carried out on the characteristics of fault activity of the Baxian Depression in recent years. Yang et al. (2002) studied the segmentary activity of the boundary fault in the Baxian Depression and analyzed its influence on the structure of the depression. Zhang et al. (2014) studied the fault activity characteristics during the Paleogene and analyzed their influence on the tectonic evolution in the Baxian Depression. Xie et al. (2015) analyzed the influence of fault activity on sand bodies during the deposition of Dongying Formation (E3d). However, previous studies were limited to the effect of fault activity on sedimentation and structure during the Paleogene, but lacked specific studies on the relationship between fault activity and hydrocarbon accumulation. Large-scale migration of oils occurred during the Neogene and faults served as important fluid migration conducts (Lu et al., 2010). Therefore, the characteristics of fault activity during the Neogene and its relationship with the hydrocarbon filling period are important factors to determine fluid migration pathways.
The objectives of this paper are to: (1) investigate the hydrocarbon filling period through fluid inclusion analysis; (2) evaluate the rate of fault displacement and duration of fault activity; and (3) analyze the effect of fault activity on the hydrocarbon distribution, to provide theoretical guidance for further exploration.
Geological setting
The Baxian Depression is located in the central part of the Jizhong sub-basin and covers an area of approximately 2090 km2 (Figure 1(a); Liu et al., 2011). Its western part is adjacent to the Niutuozhuang Uplift, its northern and southern parts adjoin the Langgu-Wuqing Depression and Raoyang Depression, respectively, and its eastern part is bounded by the Dacheng Uplift (Figure 1(b)). The Baxian Depression consists of Ertaijie Fault Terrace Buried Hill Belt, Chaheji-Gaojiabao Structural Belt, Maozhou Structural Belt, Suqiao-Xinanzhen Structural Belt, Wen'an Slope, Baxian Sag, and Dianbei Sag (Figure 1(c); Zhao et al., 2015).

(a) Locations of Bohai Bay Basin and Jizhong sub-basin. (b) Location of Baxian Depression. (c) Main structural units within Baxian Depression, showing the location of sample wells. (d) Stratigraphy of Baxian Depression with possible source rocks and main oil reservoirs. Form: Formation; PY: Pingyuan. (e) Cross section showing structural framework of Baxian Depression. Section location is shown in (c).
Above the Cenozoic basement, the Baxian Depression can be subdivided into two tectono-stratigraphic levels: a rifting stage (60.5–25 Ma) during the Paleogene and a thermal subsidence stage (25 Ma to the present) during the Neogene and Quaternary (Zhang et al., 2008). In ascending order, the synrift sediments are represented by the Kongdian (E1k), Shahejie (E2s), and Dongying (E3d) formations (Figure 1(d)). These formations were deposited in fluvial-lacustrine environments. Three hydrogen-rich, oil-prone source rocks have developed in the fourth, third, and the first member of the Shahejie Formation (E2s4, E2s3, and E2s1, respectively), and all of them have been confirmed to be effective source rocks in the Baxian Depression (Huang and Pearson, 1999). The postrift sediments consist of the Guantao (Ng), Minghuazhen (Nm), and Pingyuan (Qp) formations (Figure 1(d)). The Ng Formation is dominated by braided river sandstones whose thickness can reach up to 700 m. The Nm Formation is deposited in a fluvial environment and is dominated by thin interbedded sandstones and mudstones.
Regional uplift in the late Oligocene (27–25 Ma) created the unconformity between the E3d and Ng formations. After that, the geomorphology was relatively gentle, and the thick sandstones of the Ng Formation covers the whole Baxian Depression (Figure 1(e)).
Sampling and methods
Fluid inclusion petrography
The fluid inclusion petrography studies the fluorescence intensity and color characteristics of hydrocarbon inclusions under ultraviolet (UV) light to identify distinct hydrocarbon charges (Jiang et al., 2016; Lin et al., 2015). In this study, a total of 23 sandstone core samples were collected from 23 wells located in different structural belts within the Baxian Depression (Figure 1(c); Table 1). All samples were made into doubly polished sections of approximately 100 mm, and a Zeiss AXIO Imager D1m digital polarized fluorescence microscope was used in the fluorescence microscopy study.
Basic lithological characteristics of the core samples.
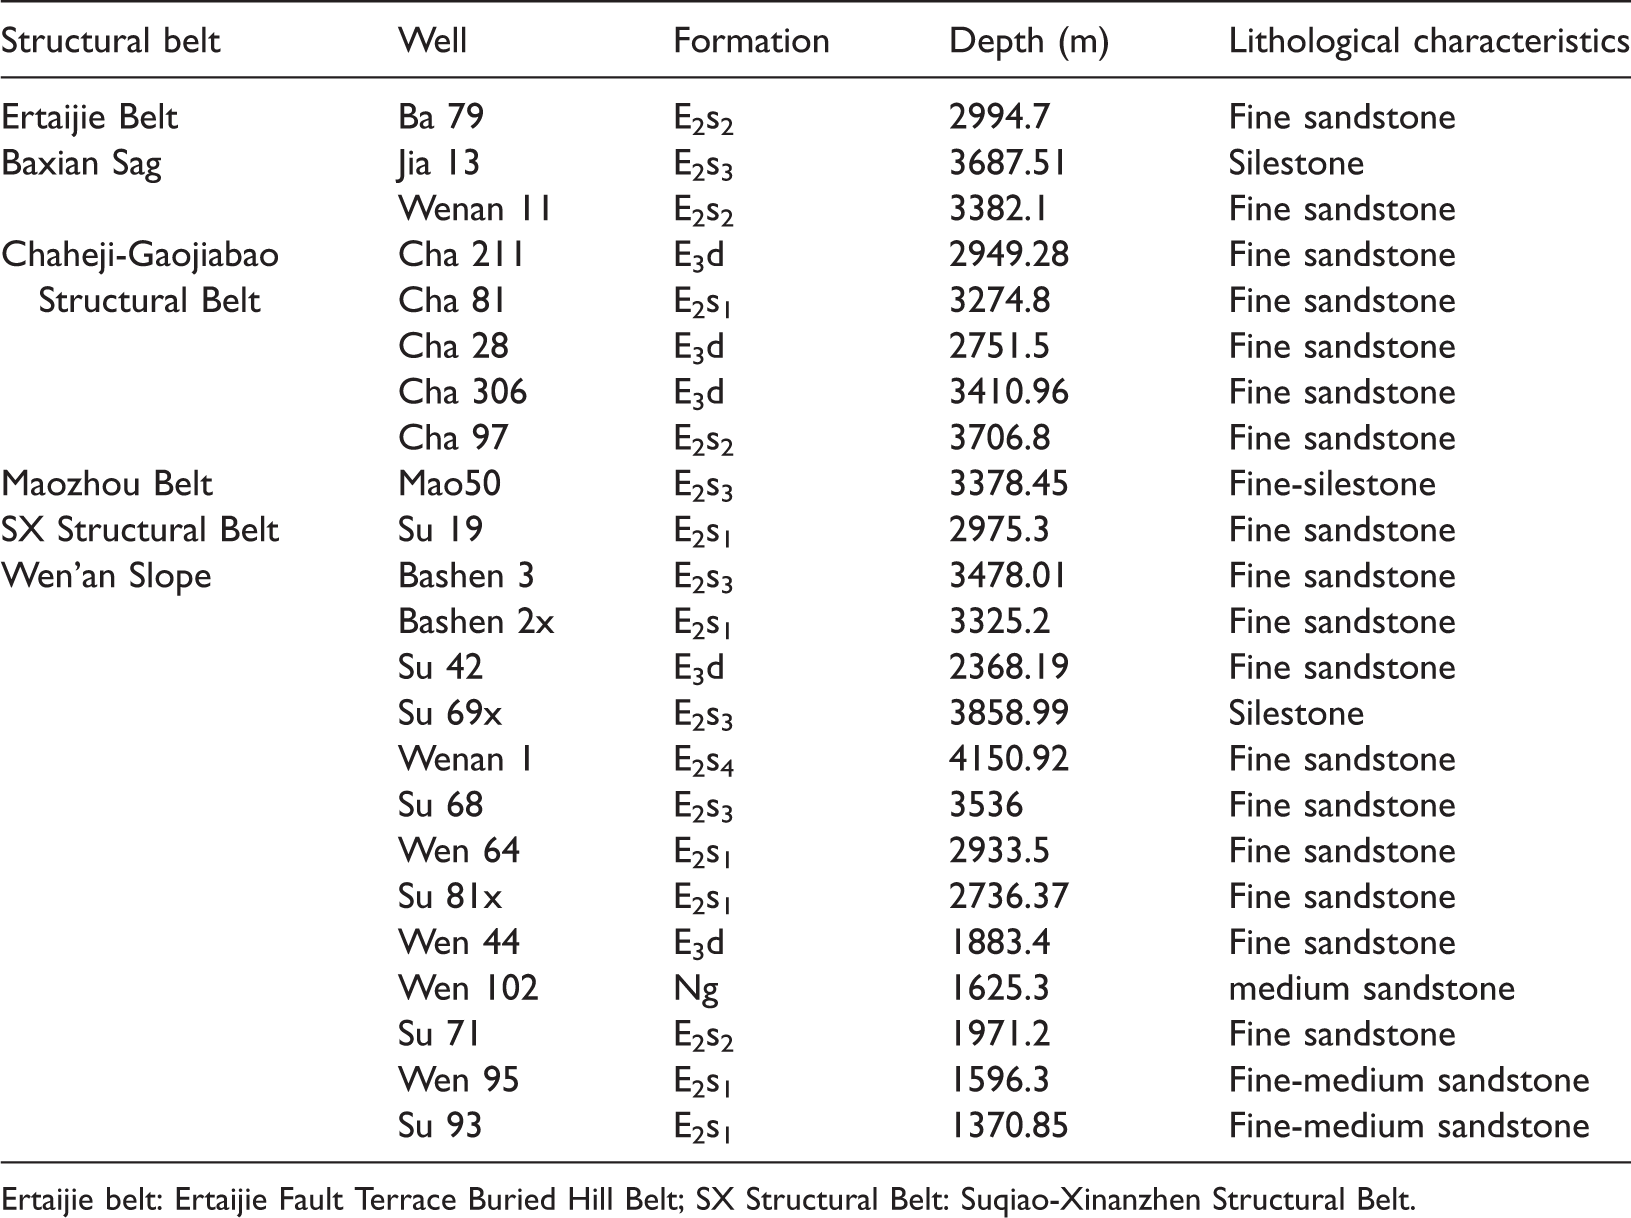
Ertaijie belt: Ertaijie Fault Terrace Buried Hill Belt; SX Structural Belt: Suqiao-Xinanzhen Structural Belt.
Fluid inclusion micro-thermometry
Combined with the buried heating history, the homogenization temperatures of the fluid inclusions represent the temperature when the inclusion is formed. Oil inclusions are generally not captured at natural gas saturation, but when restored to a single-phase state it is in saturation condition, so the homogenization temperature of the oil inclusion is generally lower than the trapping temperature, while the homogenization temperature of the associated water inclusions is generally close to the capture temperature. Hence the homogenization temperature of associated brine fluid inclusions associated with hydrocarbon inclusions can represent the temperature when hydrocarbon inclusions were formed (Jiang et al., 2016). In this study, a total of 126 inclusion thin sections were tested for the homogenization temperature by the Linkam THMS600 gas-flow heating/freezing system with a heating rate of 10°C/min.
Burial history modeling method
The burial history was simulated using the basin modeling method (Hakimi and Abdullah, 2015; Makeen et al., 2016). The modeling parameters, including stratigraphic ages, formation depth, erosion thickness, lithology, and boundary conditions (heat flow, paleowater depth and sediment water interface temperature) were all obtained using the Third Resource Evaluation of Baxian Depression.
Fault activity quantitative evaluation method
Figure 2(a) shows that the sedimentation rate exceeded the fault throw rate in all periods (Childs et al., 1993). In this case, the footwall sedimentation is controlled by regional subsidence, while the sedimentation of the hanging wall is influenced by both fault activity and subsidence (Lei, 2012). Therefore, we can use the rate of fault displacement, which is defined as the thickness difference between the hanging wall and footwall in unit time, to evaluate the fault activity. The rate of fault displacement is calculated by dividing the thickness difference by the total fault active time, as follows (Figure 2(b))


(a) Vertical displacement profiles and growth index of faults on Figure 1(e). Please see Figure 6(a) for fault number. Growth index is defined as (hanging wall thickness − footwall thickness)/footwall thickness (Childs et al., 1993). (b) Calculation of the rate of fault displacement.
The Neogene (25–2 Ma) was the main hydrocarbon expulsion stage in study area (Liu et al., 2011; Zhao et al., 2015). However, all faults except boundary faults in the study area became inactive during the deposition of Minghuazhen Formation (Nm, 12–2 Ma). Hence, the duration of fault activity during this interval (
Results and discussion
Fluorescence microscopy characteristics
Generally speaking, hydrocarbon inclusions forming in the low mature phase of source rock evolution would have a high density, because they have a high content of heavy hydrocarbon and asphaltene. In this case, their fluorescence is mainly brown. As the maturity increases, or the migration and differentiation increases, the crude oil density will decrease. Fluorescence colors of hydrocarbon inclusions captured in this stage are mainly white, yellow or yellow green. Fluorescence colors of hydrocarbon inclusions forming in the mature or highly mature phase are milky blue or blue (Liu et al., 2013).
The hydrocarbon inclusions in the study area can be divided into two categories according to their color characteristics of fluorescence: (1) with low intensity yellow-white fluorescence under UV light and light brown under transmitted light (Figure 3(a), (b), (e), (f)); (2) with high intensity blue-green fluorescence under UV light and almost colorless under transmitted light (Figure 3(c), (d), (g)–(p)). It indicates that there were two stages of hydrocarbon filling with different maturity in the study area. The yellow-white fluorescence indicates that hydrocarbon inclusions formed in the relatively low mature phase, while the blue-green fluorescence means that hydrocarbon inclusions formed in the mature phase or highly mature phase (Jiang et al., 2016; Liu et al., 2013).

Inclusion photographs under fluorescence and transmitted light of Baxian Depression. (a)–(d) Inclusions occurred in fractures through the quartz grains, Wen’an1, 4150.9 m, E2s4 Formation; (e)–(h) inclusions occurred in fractures through the quartz grains, Bashen3, 3478.0 m, E2s3 Formation; (i), (j) inclusions occurred in fractures within quartz grains, Su71, 1971.2 m, E2s2 Formation; (k), (l) Inclusions occurred in fractures within quartz grains, Wen64, 2933.5 m, E2s1 Formation; (m), (n) inclusions occurred in fractures through the quartz grains, Wen44, 1883.4 m, E3d Formation; (o), (p) inclusions occurred in fractures through the quartz grains, Wen 102, 1625.3 m, Ng Formation.
It can be found that hydrocarbon inclusions formed in the E2s4 and E2s3 formations always have two fluorescent colors, which shows that there were two phases of hydrocarbon filling within these two formations. The maturity of source rock evolution was low during the first phase of hydrocarbon filling, while the maturity was relatively high during the second one. However, hydrocarbon inclusions formed in the E2s1, E3d and Ng formations always have the blue-green fluorescence only, which indicates that there was only the second phase of hydrocarbon filling in these formations.
Homogenization temperature characteristics and hydrocarbon charging periods
As shown in Figure 4 and Table 2, the time of the first phase of hydrocarbon filling is about 27.8–25.2 Ma (from late E3d to the late uplift stage), while the time of second phase is about 12–2 Ma (the deposition time of Nm Formation). Besides, the first phase of hydrocarbon filling occurred only in the area within or close to sag zones while the second phase occurred across the whole depression (Figure 5). What is more, there were two hydrocarbon filling periods in the deep E2s4 and E2s3 Formations, but there was only the second phase occurred in the shallow E3d and Ng Formations (Table 2), among which the Ng was deposited between the two periods of hydrocarbon charges. Because the number of hydrocarbon inclusions with the second filling phase is much larger than that with the first phase, it can be found that the second filling phase (the deposition time of Nm Formation) was the main pool-forming period.
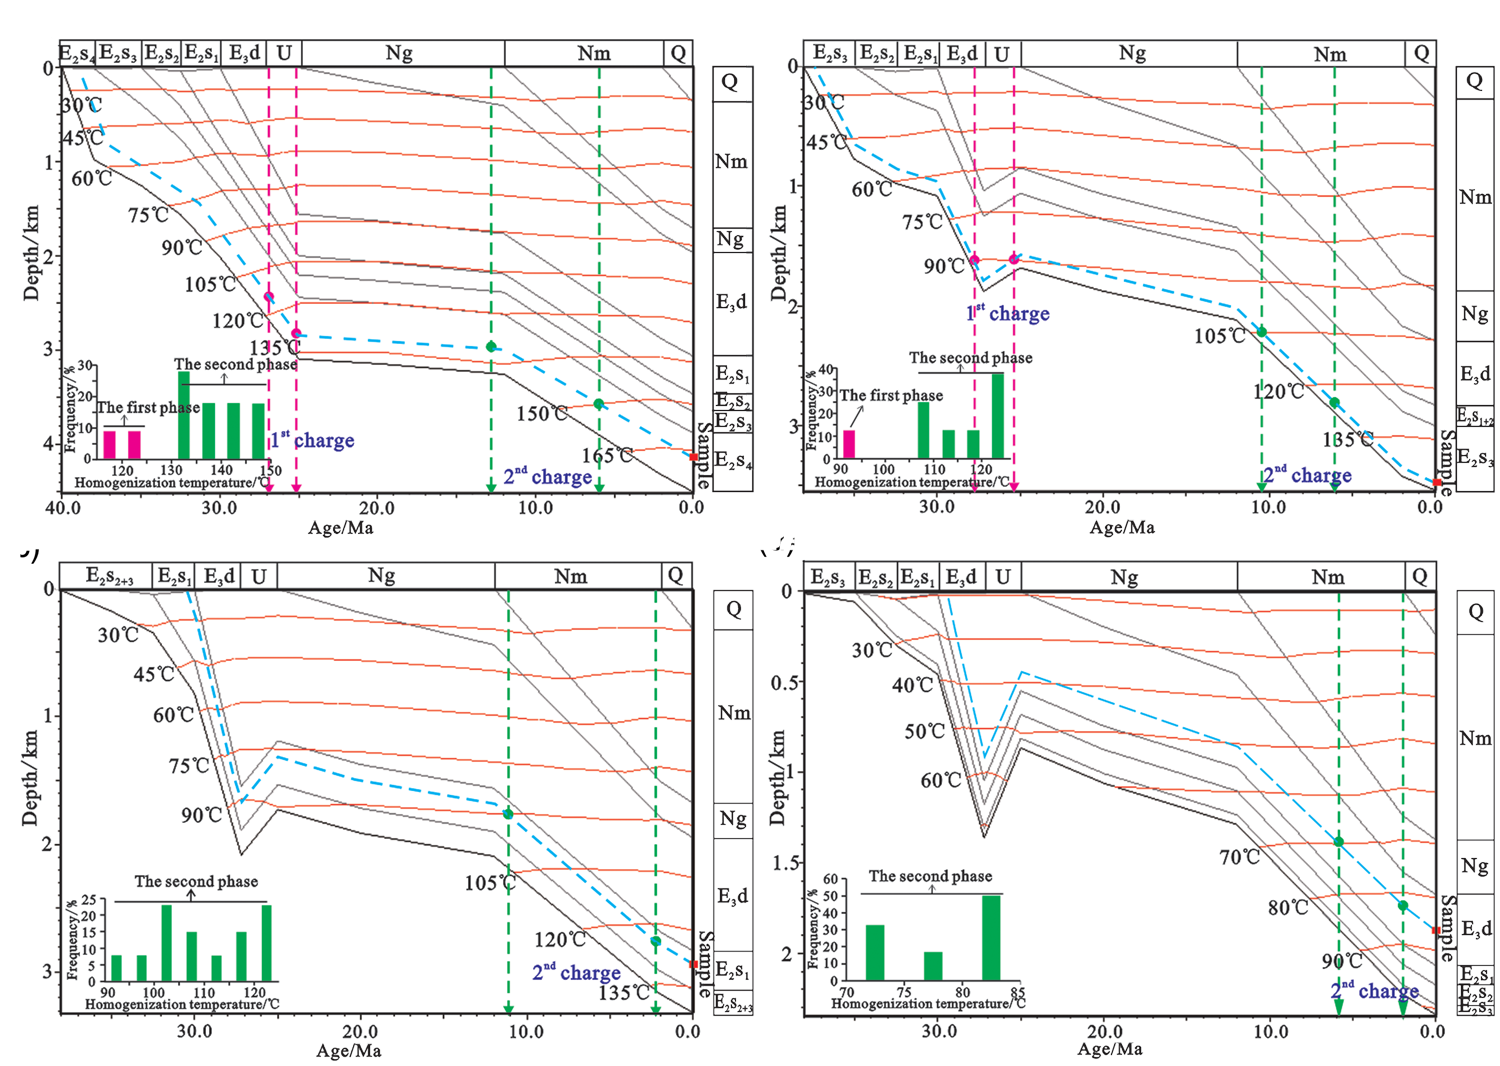
Hydrocarbon charging periods determined by homogenization temperature combined with burial history modelling. a Wen’an1, 4150.9 m, E2s4; b Bashen3, 3478.0 m, E2s3; c Wen64, 2933.5 m, E2s1; d Wen44, 1883.4 m, E3d. U: the uplift stage.
Homogenization characteristics of fluid inclusions and hydrocarbon charge time in the Baxian Depression.


Distribution of hydrocarbon inclusions in different phases of the Baxian Depression.
Cause analysis of the difference in the hydrocarbon charge history
By comparing the pool-forming time in different tectonic belts and different oil-bearing series, it can be seen that the second phase of hydrocarbon filling occurred widely, distributed almost in the whole region and all the oil-layers, while the first phase was mainly distributed close to sag zones and within the deep formations (Table 2). The difference of the hydrocarbon charge history in different parts and different layers is closely related to hydrocarbon generation and expulsion histories.
The source rocks (E2s4 and E2s3) distributed in the sag zones were in the low mature during the middle and late deposition of E3d Formation (29–27 Ma; Zeng and Wen, 2011). There was some hydrocarbon generated but only a little expelled. As a result, oils were only accumulated in the strata of source rocks (E2s4 and E2s3) within or close to deep sag zones at that time. This was the first stage of hydrocarbon generation and expulsion, which corresponds to the first phase of hydrocarbon filling. Then the regional uplift (27–25 Ma) occurred in the Baxian Depression. The evolution of source rocks stagnated and oils ceased to be generated. Until the late Ng and the early Nm period (13–10 Ma), the burial depth and maturity of source rocks has reached and exceeded the figures before the uplift, and the evolution of source rocks continued. This was the second stage of hydrocarbon generation and expulsion, in which the source rocks were at mature or high maturity stages. Faults acted as the main channel for hydrocarbon migration, and helped the oils migrate to different layers and depths to accumulate during the deposition of Nm Formation. This led to the widespread distribution of the second phase of hydrocarbon filling.
Quantitative evaluation of fault activity
According to equations (1) and (2), the fault activity characteristics in all periods of faults that remain active during the deposition time of Nm Formation are evaluated. These faults might serve as hydrocarbon migration pathways. Using the fault pattern mapped at the base of the Nm, the faults were numbered to facilitate the characterization of their fault activity (Table 3). The average rate of fault displacement was the highest during the deposition of E2s4 and E2s3. It decreased during the following E2s2. Then there was a little rise in the rate during E2s1. After that, the figure experienced some deceases until Ng. During the deposition of the Nm, the rate showed an upward trend again and finally reached 6.9 m/Myr. Besides, the average duration of fault activity during the deposition of the Nm was 0–6 Myr.
Quantitative evaluation of fault activity in Baxian Depression.

Ertaijie belt: Ertaijie Fault Terrace Buried Hill Belt.
Impact of fault activity on hydrocarbon accumulation
Based on the rate and duration of fault activity during the main hydrocarbon filling period (Nm), the transporting faults are classified into three types (Figure 6(a)): type A (with the rate of fault displacement over 10 m/Myr and duration of activity over 4 Myr), type B (with the rate about 5–10 m/Myr or the duration about 2–4 Myr), and type C (with the rate about 0–5 m/Myr and the duration about 0–2 Myr). It can be found that reservoirs formed in the non-hydrocarbon generating strata are overwhelmingly situated adjacent to the type A and type B faults which have the most rapid displacement rates and longest periods of activity (Figure 6(b)). Besides, in the regions with more type A and type B faults, the oils always accumulated in shallow layers (above the source rocks), and the responding pool-forming time was relatively later (about 6–2 Ma). From the view of tectonic belts, it is found that Chaheji-Gaojiabao Structural Belt and Wen'an Slope are more favorable for shallow hydrocarbon accumulation, and the traps near type A and type B faults in these two regions shall be the favorable exploration targets of reservoirs in non-hydrocarbon generating strata.

(a) Distributions of fault types and oil reservoirs in the non-hydrocarbon generating strata. (b) Relationship between fault activity and oil reservoirs in the non-hydrocarbon generating strata, with contours of fault types shown (broken lines).
Influencing factors of oil-bearing series
The oil-bearing series of Ertaijie Fault Terrace Buried Hill Belt and Baxian Sag are E2s4 and E2s3, and the oil-bearing series of the Maozhou Structural Belt and the Suqiao-Xinanzhen Structural Belt are E2s3 and E2s1. Oils in these areas are accumulated in deep strata near the source rocks. This is because the fault activity in these areas was weak during the hydrocarbon filling period (Table 4), and faults might not serve as effective conducts.
The relationship among oil-bearing strata, fault activity, and the thickness of strata above source rocks in different structural belts.

Ertaijie belt: Ertaijie Fault Terrace Buried Hill Belt; SX Structural Belt: Suqiao-Xinanzhen Structural Belt; CG Structural Belt: Chaheji-Gaojiabao Structural Belt.
The major oil series in Chaheji-Gaojiabao Structural Belt (E2s1 and E3d) and Wen'an Slope (E2s1, E3d, and Ng) are relatively shallow (Figure 1(e); Table 4). The fault activity in these two areas was stronger than that of the former four regions, and oils tended to migrate to shallow formations through transporting faults. By comparing these two areas, the thickness of the strata above the source rocks (E2s2, E2s1 and Ed) in Wen'an slope is thinner than that in Chaheji-Gaojiabao Structural Belt. When their vertical migration distances are similar, oils in Wen'an slope are likely to migrate to shallower strata (Table 4), although their fault activity characteristics are similar.
Conclusions
The hydrocarbon charge history was divided into two phases. The first phase was from late Dongying (E3d) to the late uplift stage (27.8–25.2 Ma), while the second phase took place during the deposition of the Minghuazhen Formation (Nm, 12–2 Ma). The second phase was the main pool-forming period. The first phase was mainly distributed near sag zones and in lower layers, whereas the second phase distributed across the whole depression and mainly in upper layers. The difference of the hydrocarbon charge history is closely related to hydrocarbon generation and expulsion histories. The average rate of fault displacement during the deposition of the Minghuazhen formation (Nm) was 6.9 m/Myr, and the average duration of fault activity during this interval was 0–6 Myr. The transporting faults are classified into three types. Reservoirs formed in the non-hydrocarbon generating strata are overwhelmingly situated adjacent to the type A and type B faults which have the most rapid displacement rates and longest periods of activity during the deposition of the Minghuazhen formation (Nm). With the increase of fault activity and the decrease of formation thickness, oils tend to accumulate in shallower strata.