
Abstract
1. Introduction
Human–robot interaction (HRI) has the goal of making possible the cooperation between humans and robots, in order to exploit the strengths of both
In the literature HRI has been largely based on vision systems, for example to recognize gestures (Li, 2012), to cooperate with robots in assembly tasks (Kimura et al., 1999), and to deal with collision detection problems (Ebert and Henrich, 2002).
Of course, when contacts occur, interaction control of the robot is required based on the capability of sensing the contact phenomena. To achieve this, force/torque sensors have been largely used in order to ensure safe physical HRI (pHRI), by detecting collisions (Haddadin et al., 2008) and ensuring robot compliant behavior in response to external forces (Duchaine and Gosselin, 2007; Grunwald et al., 2003).
Bicchi et al. (1993) have shown that for a given robot geometry for contacts over
Humans perceive contacts mostly through the skin; therefore, tactile sensors mimicking its functionality and integrated on the robot body are expected to provide additional information with respect to force/torque sensors. Large-area tactile sensors composed of different transducers (pressure, vibration, temperature, proximity, etc.), also referred to as
Usually, humans physically interact with objects, or with other people, hopefully in peaceful conditions, using their hands. Similarly, in HRI it can be expected that if an operator wants to physically interact with a robot, for example to teach a movement (Billard et al., 2008), a natural way to begin the cooperation would be touching or grasping one or more of its links. In fact, various vision-based HRI methods are based on the assumption that the hands are the main input for interacting with robots. Indeed, they address the problem of computing from images the placement of the fingers and of the palm of the human player (Liang et al., 2012; Raheja et al., 2011) in order to recognize gestures. In the pHRI domain, it can then be argued that when a person interacts using the hand, the contact distribution generated by each finger and by the palm, in terms of positions, areas, and relative applied pressures, could imply a specific type of interaction.
Therefore, according to what discussed so far, it is reasonable to assume that if a human is interacting with a robot using their hand, the contact could be interpreted as a voluntary touch, performed to start a cooperation. Then, in order to engage an appropriate HRI task, the robot must be capable of discriminating whether the applied contact has been generated by a human and it should be capable of segmenting the measured pressure distribution associated with the various parts of the hand.
In this work, we present a method based on robot skin feedback measurements to:
As shown in Figure 1, the proposed approach consists of creating a

Proposed approach: (a) a human is touching the robot arm using the hand; (b) the 3D contact measurements are mapped onto the mesh representing the robot body; (c) the robot skin measurements are transformed into an image and classified to recognize a human hand; (d) if it is, the parts of the hand are segmented; (e) the segmentation is back-projected onto the original 3D space.
This article is organized as follows. Section 2 provides a review of the literature: first the use of tactile sensors in pHRI is discussed; second the techniques related to contact shape processing are analyzed, discussing the differences and the improvements proposed in this article. Sections 3 and 4 describe the process of computing tactile images from robot skin feedback and the specific problems related to the processing of human hand contact shapes, respectively. Sections 5 and 6 describe the machine learning-based models employed for human hand recognition and segmentation. In Section 7, the experimental setup and the data collection procedure are detailed. The experimental results to assess the performance of the proposed method are discussed in Section 8. In Section 9, additional experiments are presented to analyze: (i) the robustness of the system with respect to hardware failures and changes in the spatial resolution; (ii) the transferability of the system, by testing it on a different sensorized robot part. Conclusions follow in Section 10.
2. Related work
Within the scope of this article, the role of tactile sensors has been studied with respect to two different domains of application. The first is related to HRI and the second to contact shape processing and classification.
2.1. Tactile sensors in pHRI
Tactile sensors measurements have been used in the context of HRI in order to implement touch-based control strategies.
Wosch and Feiten (2002) showed that patches of pressure sensors integrated on a robot link allow human operators to guide a robot arm. The pressure readings are translated into motion vectors used for controlling the arm position. Similarly, Schmidt et al. (2006) used an array of capacitive-based pressure sensors mounted on a robot gripper to implement a control strategy allowing the robot to adapt its posture in response to the force applied by a human operator.
Frigola et al. (2006) implemented a compliant behavior in a robot arm exploiting the feedback of a force-sensitive bumper skin. Leboutet et al. (2016) achieved whole-robot-body compliance by using a technique based on hierarchical force propagation exploiting force feedback provided by an artificial skin. Albini et al. (2017a) proposed a touch-triggered task-based control method using robot skin tactile feedback allowing a human operator to physically drive robot motions in Cartesian or joint space.
Tactile sensors have been also used to recognize different
In all the works discussed above it is implicitly assumed that a person is interacting with the robot: namely, all the contacts used for the classification have been generated by humans. Therefore, they all have not been addressing the possibility of discriminating human touch from other possible types of contacts. We show in this article that such a discrimination can be achieved by analyzing the shape of the contact pressure distribution. A review of the methods and techniques for contact shape processing is presented in the following.
2.2. Contact shape processing and classification with tactile images
In applications requiring the processing and classification the
Schneider et al. (2009) used a small pressure array integrated onto a robot fingertip to actively touch objects of interest and the resulting tactile images were classified using a bag of visual words (BoVW) model. Liu et al. (2012b) showed that tactile images generated from a fingertip can be used to classify in real-time primitive shapes and poses of the contact. Liu et al. (2012a) covered a robot hand with small planar tactile patches mapping the whole pressure readings onto a single image. Finally, they trained a neural network to classify a set of grasped objects. Cao et al. (2016) used a stream of tactile images obtained during a grasping task to classify 10 different objects using a convolutional neural network (CNN). Gandarias et al. (2018) proposed an approach where a high-resolution patch of pressure sensors integrated on a gripper is used to classify the tactile images generated by objects, human limbs, and fingers through a CNN.
In addition to the use of robot hands, other approaches employ a rectangular patch of tactile sensors mounted on the robot end-effector. Pezzementi et al. (2011) proposed to obtain a set of tactile images generated from a sequence of contacts and used a BoVW model for object recognition. A similar approach has been considered by Luo et al. (2015b) in order to classify a set of objects using an innovative
Therefore, it appears clear from the previous discussions that tactile images have been proved to be a powerful tool for classifying tactile data, although in most of the cases they have been generated from planar tactile patches containing sensors distributed on a regular grid with uniform spatial resolution and generally covering a small area.
3. Tactile image formation from distributed tactile sensors measurements
In this section, the problem of generating a tactile image from a contact distributed on the robot body is addressed. The proposed technique makes possible to create a picture of the contact with minimal distortion with respect to the original 3D shape.
3.1. Map the robot body onto a flat representation
It is assumed to have a robot link covered with robot skin (see Figure 2(a) as an example). The robot skin is here intended as a set of

Steps for constructing the 3D mesh
The position and the response of each taxel to a given pressure stimulus on the robot body are assumed to be known, possibly as the outcome of a calibration procedure. Then it is possible to define the set
A
As proposed by Cannata et al. (2010), the idea is to exploit the

Steps for constructing the tactile image from a 2D mesh with a non-uniform placement of the taxels. (a) Robot tactile map
The method described above refers to a class of robot skin systems composed of discrete taxels rigidly attached to the robot links. There are several examples of technologies corresponding to this assumption (e.g., Cheung and Lumelsky, 1989; Minato et al., 2007; Mittendorfer and Cheng, 2011; Mizuuchi et al., 2006; Mukai et al., 2008; Ohmura et al., 2006; Schmitz et al., 2011).
3.2. Tactile image creation
The tactile map
During a contact, the robot skin senses the applied pressure generating a set of measurements

Steps to obtain a tactile image. (a) Example of a physical contact of a hand on the robot forearm. (b) Pressure measurements mapped onto the mesh
In order to compute the tactile image (see Figure 4(d)), for each point of the grid

where

Interpolation with the pressure values of nearby vertices.
Here

where ⌊·⌋ is the floor function and
The conversion described previously generates a tactile image normalized with respect to the maximum value measured in the current contact. This is motivated by the fact that in this work we focus only on the shape profile generated during the contact. The normalization of
4. Tactile images from human hand contacts
Some examples of human hand tactile images generated with the discussed procedure are shown in Figure 6. As it can be seen, in some images it is possible to identify the shape of the human hand, while other pictures (e.g., Figure 6(b), (d), (f), and (g)), can be easily confused with the non-hand contacts in Figure 7. However, it is quite evident that the contact shape can vary significantly even in the images where the hand is visible. For example, Figure 6(l) clearly shows the human hand shape, whereas others just show a portion of the hand or possibly only the fingertips. This is due to various factors linked to the geometry of the robot skin and to the characteristic of the interaction.

Examples of tactile images generated by human subjects during different interactions with the robot. Some fingertips seem to be cut (e.g., Figure 6(h)) because the person did not fully touch the sensorized area.

Examples of tactile images not generated by hand contacts.
Unlike cameras, the spatial resolution of the tactile elements composing the skin can be non-uniform. Therefore, there could be areas poorly or even not sensorized at all that could produce
The flattening operation introduces distortions dependent on the “complexity” of the robot body shape. This implies that the similar contacts applied in different positions can produce slightly different 2D tactile images. Examples of this fact are given in Figure 6(h) and (k) where the fingers appear to be bent, or in Figure 6(a) and (f) where the distortions are more evident.
The tactile images are characterized by the type of interaction: for example, while pushing away the robot arm requires the whole hand, pulling the same part mainly involves the fingertips; moreover, in some actions not all the fingers or the palm are involved (see Figure 6(e) and (k)).
Depending on the human operator physical characteristics (e.g., height, size of the hands, strength, etc.) and their relative posture with respect to the robot, each subject will interact with the robot body with different intensities or configurations of the hand; for example, Figure 6(i) and (j) represent a similar contact geometry expressed with different pressure distributions.
Owing to these variabilities, it is hard if not impossible to define a general model of a human hand in contact with a robot body.
For this reason, because our goal is to classify and segment the pressure distribution, it appears reasonable to use machine-learning-based techniques. In particular,
5. Hand classification
In order to recognize whether the contact distribution is generated by a human hand, the corresponding tactile image is classified using machine learning techniques.
CNNs for image classification outperformed previous approaches (Krizhevsky et al., 2012), proving their robustness against image variations such as scale and rotation (Farfade et al., 2015). Moreover, they have been successfully employed to recognize hand gestures in real time (Kim et al., 2008; Lin et al., 2014; Nagi et al., 2011) and in tasks of tactile objects classification (Cao et al., 2016).
In this work a CNN classifier trained from scratch for recognizing the human hand touch, referred in the following as
Table 1 shows the layers of the
Structure of

The differences among the four blocks are in the number of filters of the convolutional layers and in the size of the kernels. According to Goodfellow et al. (2016), the depth of the network has been selected by increasing the number of layers and evaluating the accuracy on the training set, until a satisfactory performance has been obtained. The output of the last max pooling operator is sent as an input to a fully connected layer composed of 64 neurons (
The classification performance of
The other approach is the fine-tuning, consisting of replacing the classification layer with a new one having the appropriate number of classes and then retraining the network. During this phase, the strategy is to use a very small learning rate to update the weights of the initial layers. In contrast, a higher learning rate is applied to train the final layers, by adapting them to the new data.
Both methods have been considered in this study applied to the VGG16 model presented in Simonyan and Zisserman (2014). This model is pre-trained on the ImageNet dataset (Deng et al., 2009), and it has been proved to be a very good choice to initialize a classifier or to be used as a feature extractor (Guo et al., 2016).
Finally, the last model considered is the BoVW model, already exploited for tactile image classification.
To summarize, the four following models will be evaluated and compared.
The loss function and the hyper-parameters used during the training phase are detailed in the Appendix.
6. Hand segmentation
The goal of this section is to describe how to segment the pressure distribution applied by a human hand, in order to identify the fingers and the palm area. As tactile images are used, this task can be seen as a problem of
Modern approaches presented in the past few years, dealing with the problem of semantic segmentation, rely on deep networks performing classification tasks (Guo et al., 2018), where a label is associated with each pixel instead of the whole image. In this article, two models have been considered: the
Deep networks performing a pixel-wise classification require a large amount of data to be trained from scratch. Although we collected a dataset of human hand contacts (as detailed in the next section), the pixel-wise classification of the whole dataset is a time-consuming operation. For this reason the convolutional layers of both models are initialized with the weights of a VGG16 model trained on ImageNet. In this way, the network can be trained using less data, thus requiring just a portion of the whole dataset to be labeled.
The two models have been trained in order to segment and recognize the following six classes:
7. Dataset
In this section, the robot skin technology and the procedure used to collect a dataset for training the machine learning models are described.
7.1. Experimental setup
The robot skin used in this work is an engineered version of the technology presented in Schmitz et al. (2011). In this new version the thickness of the dielectric has been reduced to 0.5 mm in order to improve the sensitivity of the sensor. The skin is composed of interconnected modules forming a network of sensors. Each single module (shown in Figure 8(a)) is implemented with a flexible PCB and contains 11 capacitive pressure transducers. A capacitance to digital converter embedded on each module provides, for each taxel, a response in the range 0–65,535.

Experimental setup. (a) Triangular module of the robot skin. The diameter of each taxel is 3.5 mm, with a pitch of 8 mm among nearby taxels. (b) Sensorized link mounted on the real robot and covered with a conductive ground plane.
As shown in Figure 2(a), the skin has been integrated on a Baxter robot, covering the upper part of the forearm with 768 pressure sensors. The final experimental setup is shown in Figure 8(b), where the forearm is mounted on the Baxter and covered with a black conductive fabric used as a ground plane.
7.2. Data collection
The dataset has been collected performing an experiment which involved voluntary human subjects. 1 The experiment has been designed in order to capture the variabilities discussed in Section 4. The people were asked to interact with the robot arm performing the following actions:
grasp the forearm;
grasp and torque the forearm clockwise (i.e., a twist with respect to the forearm axis);
grasp and torque the forearm counter-clockwise;
push the forearm to the left;
push the forearm to the right;
push away the forearm;
pull the forearm.
Each action has been repeated twice in two different positions of the robot arm (see Figure 9). Each person interacted with the robot without any constraint related to the hand posture and intensity of the touch. After that, for five repetitions, the user moved the robot arm to a different configuration, performing one interaction of the list. In this phase, the arm position, the relative posture with respect to the robot, and the interaction type have been chosen by the user.

Two different positions taken by a human during the experiments: in front of the robot (a) and on its side (b).
Throughout the whole experiment, the robot is commanded to maintain its pose and the entire interaction has been recorded. Each interaction produced a sequence of samples consisting of sensors measurements collected with a sampling time of
The experimental procedure discussed previously is the same followed in Albini et al. (2017b). The difference is that the number of people involved in the experiment has been increased from 43 to 90. The subjects have different gender (66.67% male, 33.33% female), handedness (77.78% right, 22.22% left), and biometric characteristics (Table 2). At the end of the data collection, 1,710 tactile images of hands have been acquired.
Summary of the characteristics of the subjects involved in the experiment. The hand length is measured from the wrist to the tip of the middle finger.

In order to train the models described in Section 5, the dataset has been completed by adding 1,820
Some examples are shown in Figure 7. As an outcome, the dataset used to train the classifiers in Section 5 is composed of 3,530 tactile images. The dataset has been split into a training set (70%) and a test set (30%). In order to evaluate the classifiers on previously unseen human subjects, the test set has been created containing images generated from subjects not included in the training set.
The semantic segmentation models described in Section 6 require pixel-wise labeled tactile images as ground truth. According the discussion in Section 6, the initialization with pre-trained weights allowed only a fraction of the whole dataset to be used. In particular, 350 samples have been picked from the whole dataset of human hands and labeled pixel by pixel. The distribution of classes is shown in Figure 10. In addition for this task, the dataset has been split into a training set (70%) and a test set (30%).
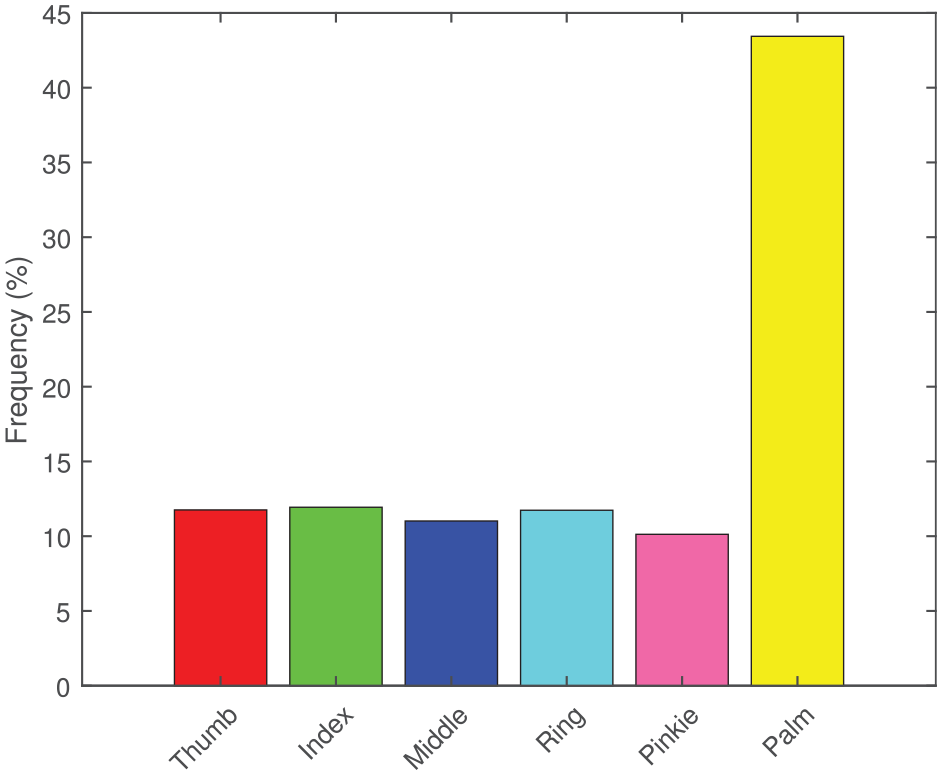
Histogram representing the average frequency of pixels for segmented class. The colors shown in the histogram are also used in the following to identify the segments in the tactile images.
Both datasets, for the classification and segmentation tasks, are provided as supplementary material.
8. Experimental Results
This section reports the experimental results obtained with the models in Sections 5 and 6 using the datasets acquired as discussed in Section 7. The models have been trained on Matlab running on a server equipped with two Intel Xeon E5 CPUs and two Nvidia P100 GPUs with 16 GB of RAM each. For each model, a set of hyper-parameters has been selected and tuned. Details about the training and tuning procedures are reported in the Appendix.
8.1. Human hand touch classification
The models trained with the parameters described in the Appendix are evaluated on the test set. The results are given in Table 3 where the mean accuracy and the classification times are reported.
Performance of the models. For each model, the mean accuracy on the test set and the time for classifying one tactile image have been computed.

A more detailed analysis about the results obtained on the test set is given in Tables 4–7, representing the confusion matrices of the models.
Confusion matrix of the

Confusion matrix of the

Confusion matrix of the

Confusion matrix of

It can be seen that
An example of tactile images misclassified by the

Examples of tactile images misclassified by HandsNet; (a) and (b) non-human hand contacts classified as hands; (c) and (d) human hand contacts classified as non-hands.
8.2. Human hand touch segmentation
To evaluate the models described in Section 6, the four metrics discussed in Long et al. (2015) have been considered. The first is the
Table 8 reports the scores obtained on the test set for each metric.
Metrics evaluated for both models on the test set.

Confusion matrix of the

Confusion matrix of the


Segmentation performed by SegNet and FCN on the same tactile image. (a) SegNet output mAcc: 98.77%. (b) FCN output mAcc: 94.86%. The first line shows the models output. The colors of the various segments are the same as used in Figure 10. The second line shows the tactile image in binary scale with red pixels corresponding to misclassified regions.
Focusing on

Examples of segmentation results. mAcc: (a) 98.88%; (b) 94.51%; (c) 98.00%; (d) 94.17%; (e) 100.00%; (f) 100.00%; (g) 100.00%; (h) 96.87%; (i) 72.21%; (j) 41.51%. First line: SegNet output. Second line: thresholded tactile image with red areas corresponding to misclassified pixels.
The network can also correctly segment fingers composed of non-connected regions as visible in Figure 13(f) and (g), or when the fingers are bent owing to the distortions introduced by the flattening (see Figure 13(h)). Figure 13(i) and (j) show instead two examples of poorly segmented tactile images with a mean pixel accuracy lower than 80%. The full list of images segmented using both models is included as supplemental material.
9. Robustness and transferability analysis
Owing to repeated physical contacts, the elements composing a robot skin are prone to failures. The complexity and the costs of the system could make it difficult or infeasible to replace a damaged part. Therefore, an analysis of the robustness of the proposed method is performed in the following, considering an increasing number of faulty tactile elements.
In particular, two different types of failures have been considered. In the first case, it is assumed that one or more groups of contiguous taxels fail during a physical interaction, causing a set of
To this aim, two experimental tests have been conducted, simulating: (i) failures of groups of taxels (
Furthermore, an additional experiment (
9.1. Test A
The goal of this experiment is to evaluate the performance of the proposed method when groups of contiguous tactile elements stop working, possibly at run time. In this scenario, it is assumed that the response of the faulty taxels is zero producing a sort of
Several tactile maps affected by randomly generated patterns of faulty taxels (i.e.,
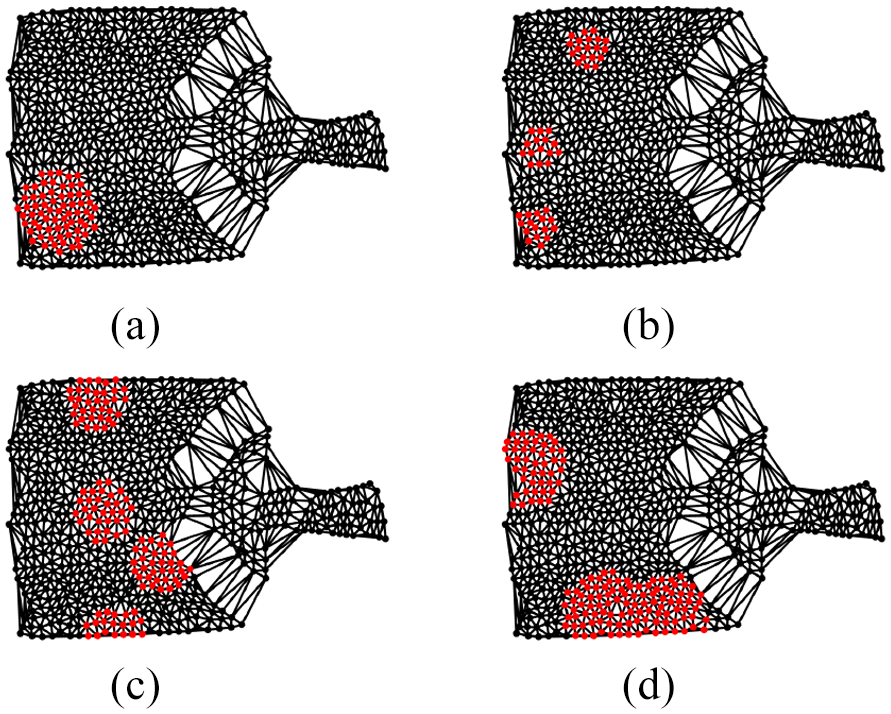
Examples of corrupted tactile maps: (a)
In order to evaluate the performance in the case of the segmentation task, the same blind spots appearing on the test images have been transferred to the ground truth images.
Tables 11 and 12 show the performance for each combination of
Test A: classification. Mean scores obtained over the 10 test sets for each combination of number of spots and radius values.

Test A: segmentation. Mean scores obtained over the 10 test sets for each combination of number of spots and radius values.

9.2. Test B
After a failure is detected and there is no contact occurring, the faulty taxels can be removed from the tactile map and the triangulation can be recomputed, thus generating a tactile map with
Once the taxels are removed from the tactile map, the triangulation is recomputed. In addition in this case, 10 patterns of broken sensors are randomly generated for each percentage value; therefore, 70 different tactile maps have been created and for each one a corresponding dataset of tactile images has been generated. Figure 15 shows examples of the degradation obtained for different percentage of removed taxels. The full list of downsampled tactile maps is included as supplementary material.

Examples of downsampled tactile maps and tactile images generated for different values of
The benchmark for the segmentation task requires labeled ground truth images (see Section 7.2). As the tactile maps have changed, to exactly evaluate the performance of the segmentation model it would require all 70 of the tactile images in the dataset to be labeled pixel-wise: this is practically an infeasible operation. In order to overcome this issue, for each low-resolution tactile images, the following procedure has been applied. Given

where

where ○ represents the pixel-wise product. Figure 16 graphically describes this process. Clearly, this is an approximation, because some of the pixels are not considered. However, it gives a

Process for generating data to evaluate the segmentation model with low-resolution tactile maps. In the example, the hand image is generated from a tactile map where 40% of the taxels have been removed.
Tables 13 and 14 list the accuracy of the models described in Section 8, evaluated on the low-resolution test sets. Similarly to
Test B: classification Mean scores obtained over the 10 test sets for each value of

Test B: segmentation. Mean scores obtained over the 10 test sets for each value of

The results obtained from this experiment show that the system is robust with respect to changes in spatial resolution of the sensors. Indeed, even with 60% of taxels removed, the system provides a classification accuracy above 90%. In the case of the segmentation task, a mean accuracy higher than 90% can be achieved considering 30% of faulty taxels.
9.3. Test C
To test the transferability of the proposed method, a custom end-effector for the Baxter robot has been designed. The new part is shown in Figure 17, along with its tactile map and an example of a tactile image generated from a human hand contact. As it can be seen, the contacts on this tactile map are mapped generating tactile images completely different from the ones used for training the models in Section 5.

The sensorized robot end-effector used in this experiment. (a) Robot end-effector partially covered with tactile sensors. (b) The robot end-effector tactile map. (c) Example of a tactile images generated by a human touching the end-effector.
Considering the classification task, to validate the
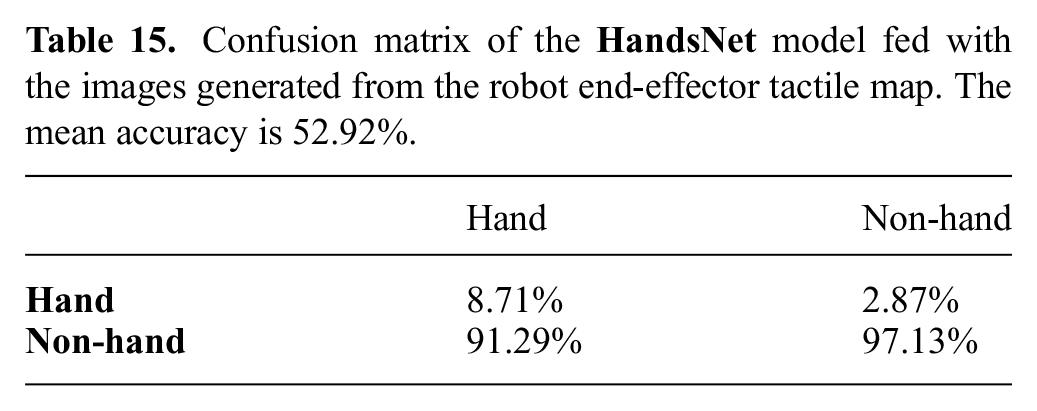
A first experiment consisted in feeding the model considering the whole amount of images as a new test set. This produced very poor results, with a mean accuracy below 53%. As it can be seen from Table 15, almost all the hand contacts are misclassified, which is reasonable, since the human hand shape is mapped in a completely different way with respect to the original case.
Confusion matrix of the
A possible solution to obtain better results would be to perform fine tuning, allowing the model to learn the newly introduced distortions. Thus, the new dataset has been split into training and test sets using the same modalities described in Section 7.2. Then a fine-tuning of the
Confusion matrix of the

10. Conclusions
In this work, a technique allowing to discriminate between human hand contacts and other generic type of contacts has been proposed. Furthermore, it has been shown that human hand contacts can be segmented with a good accuracy to recognize the various hand parts involved into the contact.
With respect to the existing literature, mostly based on the processing of planar tactile measurements, our approach is based on the transformation of tactile pressure measurements obtained from taxels non-uniformly placed on curved robot body parts. This leads to a 2D tactile image which can be processed and classified using state-of-the-art image processing techniques.
The results of this article can have a major impact in the domain of pHRI because the recognition of a human hand contact can be seen as a voluntary interaction aimed at starting a cooperation. Moreover, the possibility of segmenting the pressure distribution can provide relevant information about the role of the various part of the hand involved in the interaction. An example is given in Figure 18, where it can be seen that, after the segmentation operation, the information related to the contact distribution can be extracted for each part of the hand involved in the contact.

The segmentation is used for retrieving contact properties for each part of the hand involved in the interaction. (a) Original tactile image. (b) Segmented areas mapped on the 3D model of the robot. (c) Mean pressure distribution for each part of the hand. The scale can range from 0 to 65,536 (see Section 7.1). (d) Number of taxels involved into the contact for each part of the hand.
Furthermore, the robustness and the transferability of the proposed method have been analyzed, which, to the best of the authors’ knowledge, it is a novel contribution with respect to current tactile processing/classification literature.
The models used in the classification tasks have been implemented using Matlab 2018b, with acceptable time performance with respect to the sampling rate of the tactile images. This suggests that an efficient implementation of the models, using optimized libraries, such as Tensorflow (Abadi et al., 2015), can further speed-up the computation.
It can be observed that the proposed approach is not tied to a specific technology. Indeed, in order to create a tactile image, the major requirement is to have a discrete distribution of contact measurements on the robot body.
The results of this article represent the stand point for further research. First by considering the problem of multiple contacts. Second, addressing the problem of recognizing the type of pHRI (e.g., push, pull, twist, etc.) by analyzing the contact dynamics considering sequences of tactile images.
Supplemental Material
supplemental_material_submission_2 – Supplemental material for Pressure distribution classification and segmentation of human hands in contact with the robot body
Supplemental material, supplemental_material_submission_2 for Pressure distribution classification and segmentation of human hands in contact with the robot body by Alessandro Albini and Giorgio Cannata in The International Journal of Robotics Research
Footnotes
Funding
Supplementary material
ORCID iD
References
Supplementary Material
Please find the following supplemental material available below.
For Open Access articles published under a Creative Commons License, all supplemental material carries the same license as the article it is associated with.
For non-Open Access articles published, all supplemental material carries a non-exclusive license, and permission requests for re-use of supplemental material or any part of supplemental material shall be sent directly to the copyright owner as specified in the copyright notice associated with the article.