
Abstract
Keywords
Introduction
Compressive beamforming with a planar microphone array is a promising approach to estimate the directions-of-arrival (DOAs) and quantify the strengths of acoustic sources. Based on compressive sensing theory,1–3 the approach recovers the source distribution from an underdetermined system of linear equations by imposing sparsity constraints. The system of linear equations relates the noisy measurements of the wavefield with a microphone array to the source distribution. Due to the superiorities of strong anti-interference, low demand for the number of microphones, clear source imaging, and so on, it has attracted extensive concern recently.4–9
Conventional compressive beamforming grids/discretizes the DOA domain into a finite set of observation directions, and assumes that all sources are located in these observation directions. The sparsity constraint is imposed to minimize the
Three steps are included in the ANM-based 2D multiple-snapshot GFCB. 23 First, the atomic norm of the microphone pressure induced by sources is minimized to obtain a positive semidefinite (PSD) and twofold Toeplitz matrix that can be understood as the array covariance matrix, and meanwhile denoise the measured pressure and thus reconstruct the microphone pressure from sources. Then, the Toeplitz matrix is processed to estimate the number and the DOAs of sources through the matrix pencil and pairing (MaPP) method.23,24 Finally, the source strengths are quantified based on the reconstructed microphone pressure and the estimated DOAs. When the sources are sufficiently separated, ANM amounts to the sparsity constraint, the obtained PSD and twofold Toeplitz matrix can contain the accurate DOA information and the microphone pressure from sources can be accurately reconstructed with a high probability. However, it fails to identify sources that have a small separation. This drawback can be attributed to the fact that the atomic norm in the first step is only a convex relaxation of the source sparsity metric. This drawback limits the resolution of the ANM-based 2D multiple-snapshot GFCB. Exploring an effective method to remedy this drawback is of significance for the function perfection and performance improvement of the 2D multiple-snapshot GFCB. In this paper, an iterative reweighted ANM (IRANM)-based 2D multiple-snapshot GFCB is proposed.
The remainder of this paper is organized as follows. Section 2 presents the theory of the ANM-based 2D multiple-snapshot GFCB, and demonstrates and explains its drawback with simulations. Section 3 develops the IRANM-based 2D multiple-snapshot GFCB by illuminating its theory and revealing its mechanism with a simulated illustrative example. Section 4 compares the two strategies both with simulations and experimentally. Section 5 concludes this paper.
ANM-based 2D multiple-snapshot GFCB
Theory
In the 2D GFCB, a URMA is utilized to measure the signal. Figure 1 shows the layout, and the symbol “•” represents the microphone. Measurement layout.


The measured pressure 
In subsequent simulations, the noise is assumed to be independent identically distributed complex Gaussian. Define the array signal-to-noise ratio (SNR) as
The first postprocessing step of the 2D multiple-snapshot GFCB is to denoise 


Correspondingly, equation (5) becomes
Equation (8) can be transformed into the following trace minimization problem
23

The 
An array formed by randomly selecting partial microphones from a standard URMA shown in Figure 1 is called a non-uniform rectangular microphone array (NURMA). Employing the measured pressures of the partial microphones, the 2D multiple-snapshot GFCB can also obtain the
Simulations of drawback
A simulation example with six sound sources is designed. The DOAs of six sources are (70°, 300°), (30°, 200°), (40°, 90°), (50°, 90°), (60°, 190°), and (60°, 180°), in turn. The corresponding root mean square strengths
In this case, the ANM in equation (8) does not amount to the atomic Results of ANM-based 2D multiple-snapshot grid-free GFCB when a standard URMA with 64 microphones is utilized. (a), (b), (c), (d) Reconstructions (*) for sources (○). (e) Eigenvalues of Results of ANM-based 2D multiple-snapshot GFCB when a NURMA with 30 randomly selected microphones is utilized. (a) Layout of the NURMA. (b), (c), (d), (e) Reconstructions (*) for sources (○). (f) Eigenvalues of 

IRANM-based 2D multiple-snapshot GFCB
Theory
Build a new metric

Simultaneous equations (11) and (12) bring
The cost function in equation (13) is a combination of concave function 

Equation (15) can be solved utilizing the SDPT3 solver in MATLAB CVX toolbox.
27
Initializing 
Denoting by 
Obviously, when 

The proposition is proved in Appendix. According to the proposition, equation (15) can be rewritten as
In summary,
A simulated illustrative example
We reconstruct the source DOAs distribution assumed in Figure 2(a) by IRANM + MaPP. Here, MaPP estimates the number of sources as the number of eigenvalues of Results of IRANM-based 2D multiple-snapshot grid-free GFCB when a standard URMA with 64 microphones is utilized. (a) Eigenvalues of Results of IRANM-based 2D multiple-snapshot GFCB when a NURMA with 30 randomly selected microphones is utilized. (a) Eigenvalues of 

Performance comparisons
Simulations
We compare the reconstruction results of DOAs distribution based on ANM + MaPP and IRANM + MaPP for the sources assumed in Figure 2(a). In the former, MaPP estimates the number of sources as the number of eigenvalues of Reconstructions (*) of (a), (c), (e), (g) ANM- and (b), (d), (f), (h) IRANM-based 2D multiple-snapshot GFCB for sources (○) at (a), (b) 2000 Hz, (c), (d) 3000 Hz, (e), (f) 4000 Hz and (g), (h) 4900 Hz. The URMA with 64 microphones is utilized. Reconstructions (*) of (a), (c), (e), (g) ANM- and (b), (d), (f), (h) IRANM-based 2D multiple-snapshot GFCB for sources (○) at (a), (b) 2000 Hz, (c), (d) 3000 Hz, (e), (f) 4000 Hz and (g), (h) 4900 Hz. The NURMA with 30 microphones is utilized.

Referring to Ref. [23],we use Error curves. (a), (b) 
Experiments
As shown in Figure 9, in a semi-anechoic chamber, we use a URMA with 64 Brüel&Kjær Type 4958 microphones to conduct an experimental measurement on three small speakers to verify correctness of the simulation conclusion. The array parameters are as follows: Experimental layout.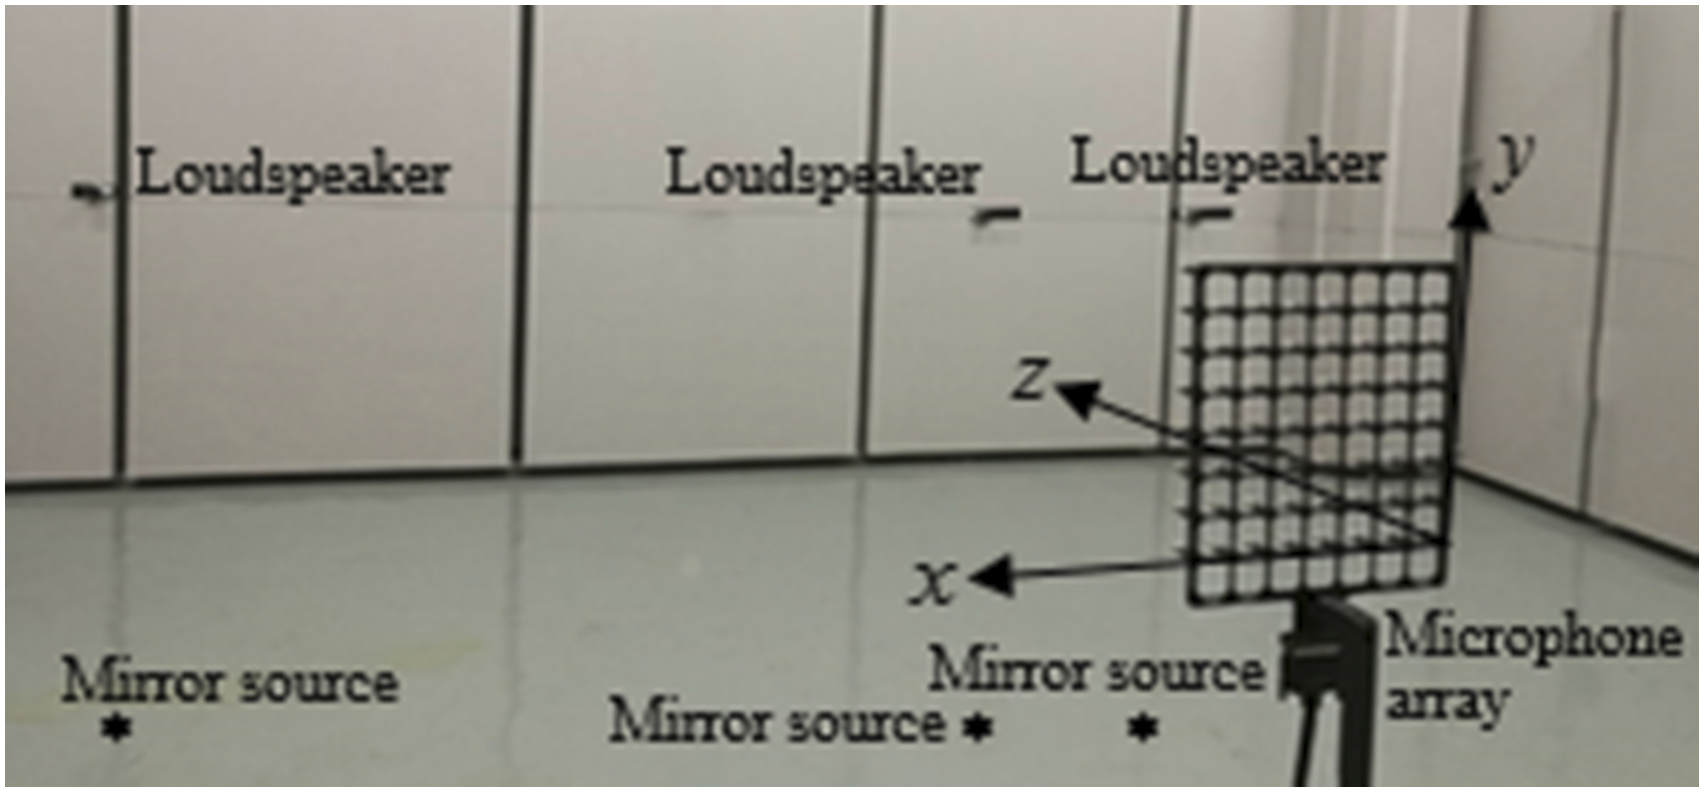
Figure 10 presents the results at 2000 Hz, 3000 Hz, 4000 Hz and 4900 Hz when all the 64 microphones are utilized. For these four frequencies, the minimum separation among these sources are Reconstructions (*) of (a), (c), (e), (g) ANM and (b), (d), (f), (h) IRANM-based 2D multiple-snapshot GFCB for loudspeaker sources and their mirror sources (○) at (a), (b) 2000 Hz, (c), (d) 3000 Hz, (e), (f) 4000 Hz and (g), (h) 4900 Hz. The URMA with 64 microphones is utilized. The symbols ○ indicate the true DOAs but do not contain the strength information, so do in Figure 11. Reconstructions (*) of (a), (c), (e), (g) ANM and (b), (d), (f), (h) IRANM-based 2D multiple-snapshot GFCB for loudspeaker sources and their mirror sources (○) at (a), (b) 2000 Hz, (c), (d) 3000 Hz, (e), (f) 4000 Hz and (g), (h) 4900 Hz. The NURMA with 30 randomly selected microphones are utilized.

Conclusions
The existing ANM-based 2D multiple-snapshot GFCB fails to work well for sources with a small separation. After analyzing the cause of this drawback, we develop an IRANM-based 2D multiple-snapshot GFCB to remedy it. Through simulations and experiments, some interesting and valuable conclusions have been drawn. First, the developed IRANM-based 2D multiple-snapshot GFCB can accurately estimate the DOAs and quantify the strengths of the small separation sources, successfully remedying the drawback of the ANM-based one and enhancing the resolution. Second, the IRANM-based 2D multiple-snapshot GFCB has stronger denoising ability and higher identification accuracy than the ANM-based one. Finally, the above conclusions hold true not only for a standard URMA, but also for a NURMA consisting of a small number of randomly selected microphones.