
Abstract
Keywords
The optimal number of response options to maximize reliability and validity in affective assessment scales is a long-standing debate. Bloom, Fischer, and Orme (2003), for example, noted that available research suggests five to seven response categories but add that a 9-point scale may be advantageous if the user is capable of making the distinctions. Krieg (1999) described statistical adjustments to compensate for problems with coarse measurement scales, concluding that increasing the number of response options would be a better choice.
In a general summary of the literature in questionnaire design, Lietz (2010) reported that 5 to 7 response options were most commonly used and that enhanced psychometric qualities, including reliability and validity, were suggested as the justification for including multiple response categories. Rodgers, Andrews, and Herzog (1992) investigated the effect of using 2 to 10 response categories and concluded that expected values of validity coefficients increased by approximately .04 with each additional response option. In contrast, Bendig (1954) and Mattell and Jacoby (1971) studied the effect of using response categories ranging from 2 to 9 and found negligible impact on reliability when the number of response categories was increased.
While Cook, Heath, Thompson, and Thompson (2001) noted that most studies appear to support the desirability of a larger number of response categories, they also cautioned that when more score intervals are available, there is an implicit assumption that the participant has the cognitive capability to process the meaning of the intervals. When that assumption is untenable, the outcome, in addition to a longer administration time, can be a reduction in score reliability. In the background of discussions about the optimal number of response categories there are two other questions. One is the long-standing debate about whether these scales produce only ordinal data that do not support parametric statistical analysis. Jamieson (2004), for example, succinctly argued for ordinal interpretation, noting that the average of “fair” and “good” is not “fair-and-a-half.” It is, however, a common practice for researchers to assume that Likert categories are “close enough” to interval-level measurement, consistent with Blaikie’s (2003) position that interval-level statistics can be justified if used with caution. Knapp (1990) summarized the pros and cons of ordinal and interval assumptions in scales using Likert categories, including challenging a belief that more response categories automatically enhance the appropriateness of parametric analysis.
In addition to questions about whether Likert response categories represent equal intervals, there is an underlying issue of inconsistency in category interpretation between individuals contributing to misleading results when responses from research participants are aggregated for analysis. To illustrate, on a 4-point scale ranging from 1 = highly unsatisfied to 4 = highly satisfied, Participant A marks 3 (satisfied) and Participant B marks 4 (highly satisfied). Arguably, the two participants could in fact be expressing exactly the same degree of experience or product satisfaction with the difference in their responses reflecting an idiosyncratic interpretation of the response category. It would be reasonable to assume that what it takes for Participant B to feel “highly satisfied” would be consistent on other questions or on the same question over time. But combining the responses of Participant A and Participant B as a part of a group measure of central tendency is inherently flawed regardless of whether the central tendency is reported as a median (ordinal) or as a mean (interval).
Little attention has been given to the potential for flawed aggregation in the research literature. It would, in fact, be quite difficult to design a study to address this concern without some direct, perhaps physiological, indicator of underlying satisfaction. While it is generally assumed that increasing the number of response categories in Likert items enhances the psychometric properties of a scale, it is possible that doing so simply increases the likelihood that psychologically homogeneous response categories are arbitrarily divided. Stated in the opposite direction, reducing the number of response categories could have a positive effect on validity of aggregated data by reducing the number of opportunities for inappropriately treating different perceptions of response categories as if they were the same.
Data obtained in two multi-instrument investigations in a university clinic/lab provided the opportunity for further investigation of the effect on psychometric characteristics of a scale when the number of alternative responses is varied. First, a simulation study was conducted comparing the effect of using 3 and 10 response categories on a visual analog scale of vocational personality traits. This was followed by a study in which participants were randomly assigned to complete one of two versions of the same vocational personality trait measure, one version with only 2 response categories or the other version with 6 response categories. The studies were designed to address two primary research questions:
These questions were selected, in part, with the belief that unless there were marked differences in favor of the larger number of response categories, researchers might be better served with questionnaires using fewer categories and thus reducing the influence of inter-individual inconsistencies in category interpretation on the resulting statistical estimates.
Simulation Study
Method
Participants
Data for the simulation study were provided by a total of 77 undergraduate students attending an urban, southwestern university in the United States. Participants were volunteers who chose this study from several different projects available to meet a research requirement for undergraduate courses in educational psychology. The majority (77%) were female. Most (73%) were in the age range of 18 to 24 with 19% in the age range of 25 to 34, 5% in the age range of 35 to 44, and 3% in the 45 and above age range. Ethnic backgrounds were as follows: Caucasian (66%), African American (10%), Hispanic American (6%), Asian American (5%), and Other or no report (13%). The primary language of the participants in the simulation study was English (92%). The range of self-reported grade point average of the participants on a 4.0 scale was 3.5 to 4.0 (39%), 3.0 to 3.4 (42%), 2.5 to 2.9 (16%), and 2.0 to 2.4 (2%).
Instrumentation
In addition to raw scores on each dimension, results on the Holland scales are typically reported as two- or three-letter codes, indicating the strongest preferences. For example, an IE code indicates that the person’s highest score was on the Investigative scale and the next highest score was on the Enterprising scale, and this ranking then becomes the basis for career exploration. The use of the ranking procedure enables some expected comparability among different vocational interest scales that differ in length and/or type of stimuli used for the assessment and does not require normative transformation.
The NEO Five Factor Inventory (NEO-FFI; Costa & McCrae, 1992) is a 60-item self-report questionnaire measuring each of the “big-five” trait dimensions of Neuroticism, Extraversion, Openness, Conscientiousness, and Agreeableness. Each scale consists of 12 items about typical behaviors or reactions that are rated according to a 5-point Likert scale, ranging from “strongly disagree” to “strongly agree.” The questionnaire yields
The Woodcock−Johnson Tests of Cognitive Ability (WJ-III; Woodcock, McGrew, & Mather, 2001) is an individually administered measure of general intellectual ability and specific cognitive abilities in children, adolescents, and adults, aged 2 years through 94 years. The battery yields a General Intellectual Ability index (GIA) that is a measure of g along with cluster scores representing the broad Cattell-Horn-Carroll (CHC) abilities and individual subtest scores.
Procedure
A series of studies conducted in a university clinic/lab in 2005-2006 that included a component of computer-based test administration provided an adventitious opportunity to investigate the effect of the number of response options in a visual analog scale. The 30 items assessing the Holland dimension in the
To illustrate, one of the adjectives for the Realistic score is “practical.” One of the adjectives for the Investigative score is “curious.” The item was presented on the computer screen to participants with “practical” on the 0 end of the visual analog scale and “curious” on the 10 end of the scale with instructions for participants to indicate their preference. If the participant clicked the 0, one point was added to the Realistic score; if the participant clicked the 10, one point was added to the Investigative score. If the participant clicked the 1, .9 was added to the Realistic score; if the participant clicked the 9, .9 was added to the Investigative score, and so forth. Participants who clicked the mid-point, 5, had .5 added to the Realistic and to the Investigative score.
To estimate the effect of a significant reduction in response options, the scales were then rescored with two scenarios to simulate responses if there had been only three options to express the degree of preference. For the first simulation scenario, using the “practical” or “curious” example in the previous paragraph, clicking 0 to 4 resulted in one point added to the Realistic score; clicking 6 to 10 resulted in one point added to the Investigative score. Clicking the mid-point of the scale resulted in .5 point added to each of the two scores.
Recognizing that it would be at least equally plausible to extend the range for the simulated middle score, a second 3-option scenario used a different rubric. In the second scenario, when simulating the scoring of the “practical” or “curious” stimulus, responses from 0 to 3 added one point to the Realistic score, responses from 7 to 10 added one point to the Investigative score, responses of from 4 to 6 added .5 to each of the two scores, and so forth.
An appointment session for each participant began with the completion of demographic information and review and signature on human subjects consent forms. Individual administration of selected cognitive scales was then provided by school psychology graduate students, followed by completion of a series of computer-administered scales, including the vocational personality scale that is the focus of this study.
Results of the Simulation Study
Table 1 displays the descriptive information for the 10-option and the two simulated 3-option scenarios for each of the six vocational personality scales. A perusal of Table 1 suggests that the different response options did not appear to have a marked effect on the obtained mean scores. Paired sample
Simulation Study: Descriptive Statistics for Vocational Personality Trait Scores With 10-Option and Simulated 3-Option Scenarios (

Note: Statistically significant difference between mean scores only on Enterprising scale. 3-Option: 1 is Scenario 1 with original scores of 5 coded as 2 in 3-point simulation. 3-Option: 2 is Scenario 2 with original scores from 4 to 6 coded as 2 in 3-point simulation.
Results from a large-scale meta-analysis (Larson, Rottinghaus, & Borgen, 2002) of tests of the six Holland vocational personality dimension and “big-five” personality traits suggest a predictable relationship between several of the scores. Their analysis suggested a consistent positive relationship between the following:
Artistic vocational personality trait and big-five Openness trait
Enterprising vocational personality trait and big-five Extraversion trait
Social vocational personality trait and big-five Extraversion trait
Social vocational personality trait and big-five Agreeableness trait
Investigative vocational personality trait and big-five Openness trait
Conventional vocational personality trait and big-five Conscientious trait.
Table 2 displays the relationship between the 10-option and the two scenarios for simulated 3-option scoring of the vocational personality scales and the big-five personality trait scores as measured by the NEO-FFI. A perusal of Table 2 shows the expected pattern between vocational personality dimensions and big-five personality traits on four of the six relationships, Enterprising–Extraversion, Investigative–Openness, Social–Agreeableness, and Conventional–Conscientiousness. Using the Fisher
Simulation Study: Pearson Product–Moment Correlation Coefficients Between NEO Personality Trait Scores and Vocational Personality Traits With Three Scoring Conditions (

Note: N = Neuroticism; E = Extraversion; O = Openness; A = Agreeableness; C = Conscientious. 3-Option: 1 is scenario one with original scores of 5 coded as 2. 3-Option: 2 is scenario two with original scores from 4 to 6 coded as 2.
It is typical for scores on instruments measuring the six vocational personality dimensions to be interpreted as codes or types based on ranking of the responses on the dimensions (Holland, 1997). In the simulation study, three separate analyses explored whether the number of response alternatives impacted score rankings on the six scales: (a) analysis of the congruence with different response option numbers, (b) analysis using a two-factor interpretation in which the two factors are based on individual scale ranking, and (c) direct comparison of the ranks obtained using the 10-option and the two 3-option scenarios.
For the congruence analysis, three Holland codes (two-letter) were generated for each participant based on 10-option scoring and each of the 3-option scoring scenarios. The two-letter code represents the two highest ranked scale scores for the participant, for example, a participant whose highest scores were on the Realistic and Investigative scales would have a code of RI. Three Iachan indices (Iachan, 1990) were then calculated to assess the congruence of the codes from the three scoring procedures.
With two-letter Holland codes, the Iachan congruence index can range from zero to six, with six indicating that the two-letter codes are identical. Iachan index scores of five or six are interpreted as highly congruent; index scores of three and four are interpreted as moderately congruent; index scores less than three are interpreted as incongruent (Cowger, Bickham, Miller, & Springer, 1999). The mean congruence index for the codes based on the 10-option scoring and codes based on the simulated 3-option-scenario 1 scoring in this study was at the level identified as highly congruent (
Data were available in the simulation study that enabled the possible influence of ability on congruence of the 10-option and 3-option scoring procedures to be tested. For the independent variable, the Iachan congruence index scores were divided into two categories: high congruence, defined as indices 5 or greater, and moderate/incongruent, defined as indices less than 5. Participant scores on the WJ-III GIA served as the dependent variable.
Of the 77 participants, 62 had a high level of congruence in codes from the 10-option and 3-option-scenario 1 rankings. There was no apparent relationship between ability and extent of congruence,
A comparable procedure was used to assess the possible influence of personal distress on the utility of the three scoring procedures with the NEO Neuroticism scale serving as the dependent variable. The difference in mean Neuroticism scores between participants in high congruence and moderate/incongruent Iachan index categories using 10-option and 3-option-scenario 1 scaling was not statistically significant,
Prediger, Swaney, and Mau (1993) proposed a two-factor solution, devising a procedure that uses a weighted ranking of the six Holland dimensions to create two summary scales. One creates a “preference for working with things” versus “preference for working with people” scale, and the other creates a scale with a continuum of preference for working with data or preference for working with ideas.
Differences in mean scores on the things-people scale for the three scoring conditions in the simulation study were not statistically significant. Using paired samples analysis, the results were as follows: 10-option versus 3-option-scenario 1,
On the data-ideas scale, there was a statistically significant difference when comparing the mean score using 10-option scoring with the mean score using 3-option-scenario 2 scoring. Other comparisons were not statistically significant, and all effect sizes were small. The results on the data-ideas scale were 10-option versus 3-option-scenario 1,
The Wilcoxon Signed Ranks Test for related samples was used for direct comparison of the ranks of the six Holland scales obtained with each of the three scoring conditions. Of the 18 comparisons, without Bonferroni correction for multiple comparisons, only 2 were statistically significant: rank of the Artistic scale in the 10-option scoring condition versus rank of the Artistic scale in the 3-option-scenario 1 simulation (
Split-half (alternating items) reliability coefficients were calculated for each of the six scales in the 10-option scoring and the two 3-option simulation scenarios and corrected using the Spearman−Brown prophecy formula. Results are displayed in Table 3. With the Bonferroni correction for multiple comparisons, none of the differences in reliability estimates produced by the different number of response options were statistically significant.
Simulation Study: Split-Half Reliability Estimates With Spearman–Brown Prophecy Formula for Scoring Conditions With Vocational Personality Traits.

Note: In Scenario 1, scores of 5 were coded as 2 for a three-response category simulation. In Scenario 2, scores from 4 to 6 were coded as 2 for a three-response category simulation.
Study 2
Results of the simulation study challenged the belief that additional response alternatives would have meaningful impact on psychometric characteristics of a vocational personality scale. But there was an obvious limitation with the varied number of responses simulated rather than directly tested. It may, for example, be a reasonable assumption that participants who chose a middle response in the standard format would also have chosen a middle response in a 3-point format. And, it may be reasonable to assume that those who selected among the several choices on either side of the mid-point would have chosen the option in that direction if only one had been available. But, these, particularly regarding participants who did not choose a middle response, are only assumptions that could not be directly addressed in a simulation design.
Study 2 was a follow-up using the same core instrument but with a design enabling direct comparison of the impact of varying the number of alternative responses.
Study 2 Participants
Data for Study 2 were provided by 192 participants, volunteers who chose this study from several different projects available to meet a research participation requirement for courses in educational psychology. The study was conducted in the summer and fall of 2010. Most participants (79%) were female. The majority (59%) were in the age range of 18 to 24 with 28% reporting an age range of 25 to 34, 9% reporting an age range of 35 to 44, and 4% reporting an age range of 45 or older. Self-reported ethnic backgrounds were Caucasian (60%), Hispanic American (16%), African American (8%), Asian American (6%), and Other (9%). English was the primary language for all participants in Study 2. The range of self-reported grade point average of Study 2 participants on a 4.0 scale was 3.5 to 4.0 (41%), 3.0 to 3.4 (42%), and 2.5 to 2.9 (17%).
Study 2 Instrumentation
International Personality Item Pool–50 (IPIP-50)
In Study 2, the big-five personality characteristics were measured using the 50-item scale from the IPIP (http://ipip.ori.org/ipip/). The IPIP (Goldberg et al., 2006) is an open source resource with sample questionnaires for personality constructs including the five-factor model of Extraversion, Neuroticism, Agreeableness, Conscientiousness, and Openness to Experience. Reliability estimates (Cronbach’s alpha) in this participant sample for the Extraversion, Neuroticism, Agreeableness, Conscientiousness, and Openness to Experience scales were .88, .84, .77, .83, and .75, respectively.
Vocational Efficacy Scale
This subject pool study also included a measure of vocational efficacy organized around the Holland six dimensions. Participants were instructed to respond to questions about the extent to which they felt confident in their ability to perform various tasks associated with each of the dimensions. Reliability estimates, Cronbach’s alpha, for the efficacy dimensions of Realistic, Investigative, Artistic, Social, Enterprising, and Conventional were .79, .78, .74, .77, .77, and .77, respectively.
Study 2 Procedure
All scales were completed in an online format. Participants were randomly assigned to complete the
The random assignment appeared to identify equivalent groups with no statistically significant difference in the demographics of the two groups evident on gender, χ2(1, 192) = .914,
The randomly assigned groups were also compared on results of the IPIP-50 scale used to test the big-five personality characteristics as a validity measure in Study 2. No statistically significant differences were found on the Neuroticism trait between the binary (M = 32.3) and Likert (M = 31.2) groups,
Study 2 Results
Consistent with the procedure described in the simulation study, the total score for each dimension was weighted by the extent of preference. For example, the adjective “efficient” is associated with the Conventional scale in the Holland model; “curious” is associated with the Investigative scale. In the binary format, the participant receives a score of 1 on one of these two scales dependent on the selection. In the 6-point Likert format, the points are awarded based on the extent of preference (e.g., much more likely to be efficient was 1 point on the Conventional scale, somewhat more likely to be efficient was .66 point on the Conventional scale, slightly more likely to be efficient was .33 on the Conventional scale, and so forth.)
Table 4 displays the descriptive information for the binary and the 6-point scoring for each of the six vocational personality scales. As expected, the “all or nothing” response mode resulted in higher raw scores in the binary format on all scales. All mean differences were statistically significant.
Study 2: Descriptive Statistics for Vocational Personality Trait Scores With Binary and 6-Point Likert-Type Response Options.

Note: Statistically significant differences (
Table 5 displays the relationship between the binary and 6-point scoring of the vocational personality scales and the big-five personality trait scores. A perusal of Table 5 shows the expected statistically significant positive relationship between the Artistic vocational personality trait and big-five Openness trait (binary response mode), the Enterprising vocational personality trait and big-five Extraversion trait (both response modes), the Social vocational personality trait and big-five Extraversion trait (Likert response mode), and the Social vocational personality trait and big-five Agreeableness trait (both response modes). Moreover, as expected, there were statistically significant positive relationships between the Investigative vocational personality trait and big-five Openness trait (Likert mode) and the Conventional vocational personality trait and big-five Conscientious trait (both response modes).
Study 2: Pearson Product−Moment Correlation Coefficients Between Big-Five Personality Trait Scores (IPIP) and Two Scoring Conditions for Vocational Personality Traits.

Note: IPIP = International Personality Item Pool. Big-Five: N = Neuroticism; E = Extraversion; O = Openness; A = Agreeableness; C = Conscientious. Binary-Likert: R = Realistic; I = Investigative; A = Artistic; S = Social; E = Enterprising; C = Conventional.
There were only two instances where there appeared to be a marked difference contingent on the response mode in the predicted relationships with big-five personality traits, one in favor of the binary response mode and one in favor of the Likert response mode. Using the Fisher
For exploration of the impact of the number of response alternatives on the rankings typically used for interpretation of scores on the six vocational personality traits, the Iachan congruence index was not appropriate in Study 2 because different participants completed the two versions of the
Differences in the things-people scale and data-ideas scales for the two response modes in Study 2 were not statistically significant,
For a direct comparison of the ranks, the nonparametric Mann−Whitney
One additional scale, not available for participants in the Simulation study, was available for use as an external criteria measure in Study 2. The relationships between the binary and Likert scoring of the vocational personality traits and the scores on a vocational efficacy scale are displayed in Table 6. A perusal of Table 6 suggests that, in general, the expected relationships between vocational personality trait and vocational efficacy scores were evident with no apparent advantage for the 6-point scoring. In fact, of the statistically significant relationships, most were in favor of the binary scoring. Using the Fisher
Study 2: Pearson Product−Moment Correlation Coefficients Between Vocational Efficacy Scores and Two Scoring Conditions for Vocational Personality Traits.

Note: R = Realistic; I = Investigative; A = Artistic; S = Social; E = Enterprising; C = Conventional.
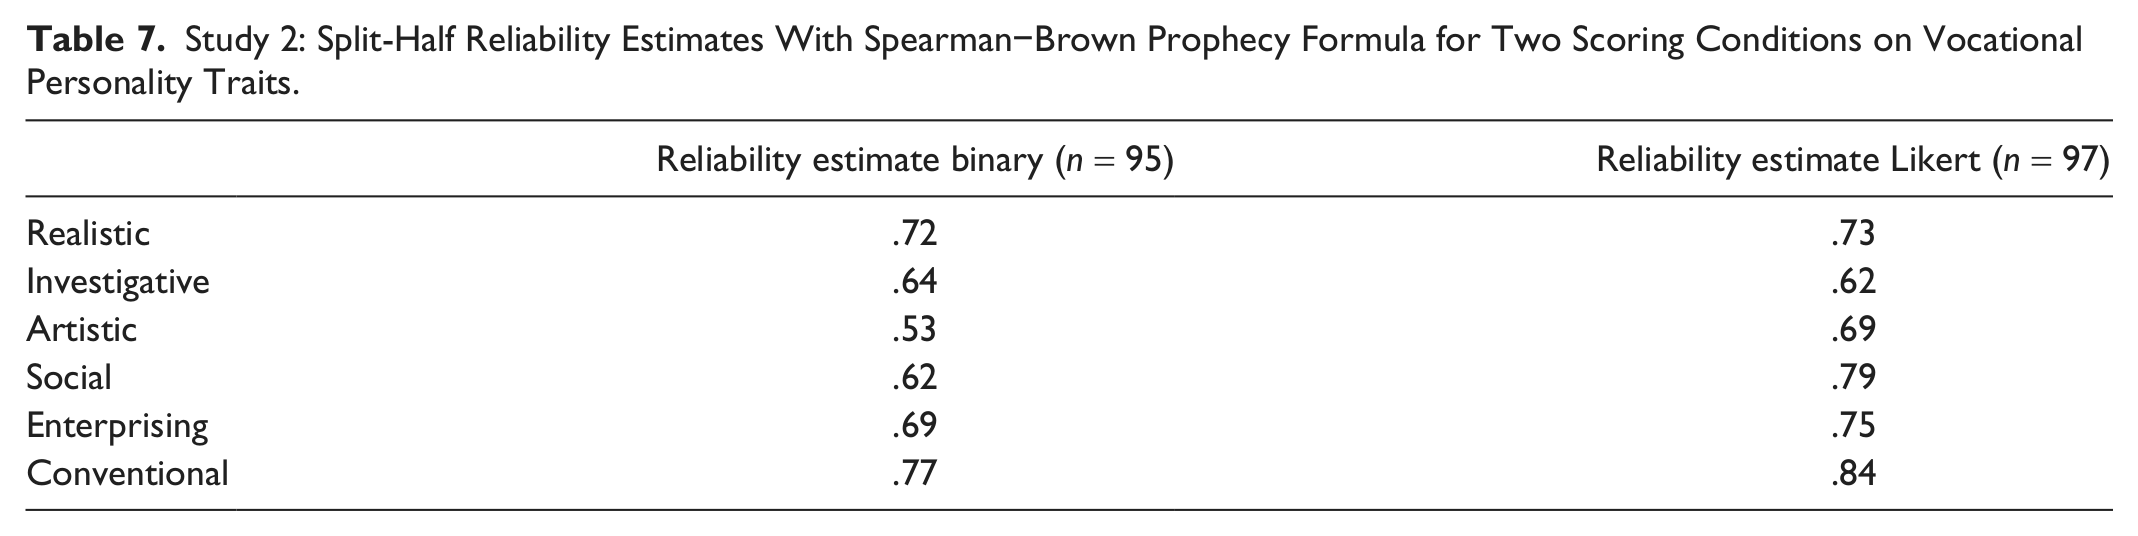
Split-half (alternating items) coefficients were calculated for each of the six scales in the binary and in the Likert formats and corrected using the Spearman−Brown prophecy formula. Results are displayed in Table 7. With the Bonferroni correction for multiple comparisons, none of the differences between binary and 6-point Likert scoring were statistically significant. Results with this participant sample are consistent with other reliability data for the
Study 2: Split-Half Reliability Estimates With Spearman−Brown Prophecy Formula for Two Scoring Conditions on Vocational Personality Traits.
Discussion of Two Studies
Cautions in generalizing to other participant samples and a need for additional study are typically found in the discussion section of published research studies but are particularly important in interpreting the results reported here. One obvious limitation in generalizing the results of these studies is the nature of the sample. All participants in both studies were university students who were participating to meet a research requirement. The number of participants, particularly in the Simulation study, was relatively small. The Simulation study included only two of the many possible simulation scenarios for the number of response options. In addition, the extent to which a simulation will reflect an actual response choice in a real-life setting is always uncertain.
In reference to the first research question, the impact on measurement statistics, the only clearly evident effect in either of these studies was an increase in the mean scores when the binary (all or nothing) results were compared with six response categories with partial credit. While no definitive conclusions could be drawn from the split-half reliability estimates in the two studies, there was no apparent consistent enhancement or decrement of the estimated reliability with the different numbers of response options. In the Simulation study, most reliability estimates were low under all conditions, but there was no trend indicating advantage or disadvantage of the number of options. Reliability estimates in Study 2 trended higher for the Likert response options compared with the binary option, but the differences did not rise to a level of statistical significance.
Possibly confounding interpretation of the measurement statistics, including the reliability estimates, in these studies is that the forced-choice format in the core instrument results in ipsative scores, an artificial interdependence among the six scales that may have an influence on psychometric properties. While it has been suggested (Baron, 1996) that ipsative scoring may actually control for bias that is inherent in Likert-type responses, further study using a core instrument with normative scoring would be advantageous.
In reference to Research Question 2, neither study found evidence indicating increased utility in prediction of related external criteria associated with the number of response categories. In the Simulation study, the two scenarios with 3 response categories appeared as effective as 10 response categories in predicting scores on a measure of core personality traits and in creating ranks used for interpretation of vocational personality dimensions. In Study 2, 6 response categories appeared no more effective than 2 response categories in predicting scores on a different measure of core personality traits, creating ranks used for interpretation of the vocational personality dimensions, or in predicting scores on a self-report of vocational efficacy.
Considering the limitations described above, these studies are not sufficient alone for conclusions about the optimal number of response categories. These findings, however, do appear sufficient for a “that is correct” response to the suggestion in the title of this article that “more may not be better” and to support a need for additional studies comparable to Study 2 with random assignment of the number of response options, more diverse participant samples, and perhaps a core instrument that does not use ipsative scoring.