
Abstract
Introduction
Although hearing devices can help to overcome even severe hearing problems, they are often not optimally adapted to the user. To improve the listening outcome in all situations and for optimal individualization, future hearing devices could exploit brain signals of the user derived from electroencephalography (EEG) measurements (Popelka & Moore, 2016). Specific applications could be automatic objective fitting of the device based on neural responses (Finke, Billinger, & Büchner, 2017; Lunner & Neher, 2013) or real-time steering of signal enhancement algorithms based on the decoded direction of attention (Bleichner, Mirkovic, & Debener, 2016; O’Sullivan et al., 2017, 2015). The integration of EEG into hearing devices needs to be convenient for the user, so that it can be used without stigmatization in everyday situations. In the recent years, several approaches have been presented that allow to record EEG reliably in and around the ears, referred to as ear-EEG (Bleichner & Debener, 2017; Debener, Emkes, De Vos, & Bleichner, 2015; Goverdovsky, Looney, Kidmose, & Mandic, 2016; Looney et al., 2012). It has been shown repeatedly that ear-EEG can record a wide variety of cognitive processes related to auditory perception and auditory attention (Debener et al., 2015; Looney et al., 2012; Mikkelsen, Kappel, Mandic, & Kidmose, 2015; Mirkovic, Bleichner, De Vos, & Debener, 2016). However, to the authors’ best knowledge, ear-EEG has never been evaluated in a situation where it was integrated with a live ear-level hearing device.
We therefore present a first feasibility evaluation of integrating ear-EEG with a live electroacoustic hearing device. We combined a recently presented experimental high-fidelity in-the-ear hearing device (Denk, Hiipakka, Kollmeier, & Ernst, 2017) with an around-the-ear electrode array consisting of 10 electrodes arranged in a C-shape (cEEGrid; Bleichner & Debener, 2017; Debener et al., 2015; www.ceegrid.com) and 3 electrodes distributed in the concha (in-concha electrodes). To evaluate auditory perception through the hearing device, we examined whether perceivable switches in the electroacoustic transmission properties of the hearing device between repeated presentations of otherwise identical stimuli can be identified in the ear-EEG.
For identification of the switches in the EEG data, we specifically focused on the amplitudes in the latency ranges of the N100 and P300 event-related potential (ERP). The N100 is an ERP component that can be detected in response to an auditory stimulus and has a maximal amplitude between 50 to 150 ms after sound onset (Näätänen & Picton, 1987). The N100 component shows a clear amplitude reduction for repeated sounds in a sequence, but amplitude increases again when a deviant sound is presented (Barry, Cocker, Anderson, Gordon, & Rennie, 1992). The property of an amplitude reduction for repeated identical sounds and the amplitude recovery when a nonidentical (deviant) sound is presented provides an objective means to study whether sequential sounds are perceived as different or identical. The P300 with a maximal amplitude at around 300 to 500 ms after stimulus onset is a second ERP component that is elicited by task-relevant, deviant sounds and reflects the more conscious evaluation and categorization of the stimulus (Polich, 2007). For the N100, we expected that the repetition of identical sounds leads to an amplitude reduction, while a deviant sound leads to an amplitude increase. For the P300, we expected a higher amplitude for a repeated deviant sound compared with a repeated identical sound. Importantly for the integration of EEG in hearing devices, these ERPs are comparatively robust responses that can be expected to be also recorded reliably under everyday situations outside of a lab context. ERPs can be exploited, for example, for automated fitting of hearing devices (Finke et al., 2017; Lunner & Neher, 2013).
The position of ear-EEG electrodes is a crucial factor for future integration into one combined ear-level hearing device. There appears to be a trade-off between the compact positing of the electrodes to assure ease of use and optimal sensitivity to the brain signal of interest. Therefore, we compared the signal properties of the around-the-ear and in-concha electrodes. Due to the larger interelectrode distance of the around-the-ear electrodes compared with the in-concha electrodes and a finer angular coverage of bipolar channel orientations (Bleichner & Debener, 2017), we expected a larger signal amplitude, better channel independence, and a better signal-to-noise ratio (SNR) for around-the-ear than in-concha recordings (Bleichner et al., 2015).
Methods
Participants
Seventeen subjects (age 28.4 ± 5.4, 10 male, 7 female) with clinically normal hearing participated in the study. Normal-hearing participants were used here as we were interested in the general feasibility of our approach. The study was conducted in agreement with the declaration of Helsinki and was approved by the local ethical committee of the University of Oldenburg (Drs. 5/2015). Before active participation, each participant gave written informed consent.
Acoustic Setup
The participants were equipped with a prototype hearing device as presented by Denk et al. (2017). It consists of an individual soft silicone earmold with an integrated set of electroacoustic transducers as shown in Figure 1. External sound is captured with the inbuilt pickup microphone located in the concha, processed, and played back on the inbuilt loudspeaker. Real-time processing was performed on a laptop running the Master Hearing Aid platform (Grimm et al., 2006), which was connected to the transducers through an Left: Photograph of the setup in the ear of a subject, with the cEEGrid glued around the ear using double-side adhesive tape. In the concha, the earmold containing the transducers of the hearing device (Denk et al., 2017) and three additional electrodes (black wires) are placed. Center: Schematic view of the layout in the ear. Gray circles indicate electrodes with their according nomenclature; red symbols mark the positions of electroacoustic transducers. The shaded area marks the part of the earmold which is inserted into the ear canal. Electrode CLF has been placed at one of the indicated alternative locations in the individual ears, depending on which was feasible. Right: Subject wearing superaural headphones (AKG K-1000) which provide sufficient free space for the hearing device and electrodes.
The hearing device was automatically calibrated in situ for each user to account for individual variations of the external ear (see Denk et al., 2017, for details). The aim was to provide acoustic transparency, that is, the pressure at the eardrum with the device inserted approximates the pressure at the eardrum that can be observed with an open ear (i.e., an unoccluded ear canal). The processing chain (here a finite impulse response filter) was individually adapted in a way that the superposition of electroacoustically generated sound and a direct sound component leaking through the vented earpiece approximated the open-ear condition. Thereby, an additional microphone located at the inner surface of the device pointing toward the eardrum was utilized to estimate the pressure at the eardrum.
Stimuli were presented on super-aural headphones (K-1000, AKG, Vienna, Austria), which are also shown in Figure 1. The special design assured that neither the electrodes nor the hearing device was touched by the headphones. This setup represents a sound-source coupling to the ear similar to the free field (Møller, Hammershøi, Jensen, & Sørensen, 1995). The stimuli were presented monaurally on the right ear only, which was equipped with a hearing device, whereas the left ear was fully occluded.
EEG Setup
EEG was acquired with a cEEGrid including 10 around-the-ear electrodes arranged in a C-shape (Bleichner & Debener, 2017; Debener et al., 2015) and 3 electrodes positioned at different positions in the concha (in-concha electrodes) by insertion into bores in the earmold (see Figure 1). Only electrodes positioned at the right ear were considered, that is, the side where the hearing device was located, to emulate a fully integrated system. The in-concha electrodes were Ag/AgCl miniaturized (2 × 4 mm) ton electrodes (i.e., shaped cylindrical, EasyCap GmbH, Herrsching, Germany) as used in an earlier study (Bleichner et al., 2015). After skin preparation with an abrasive gel and alcohol, a small amount of electrolyte gel (Abralyt HiCl, Easycap GmbH, Germany) was applied to the electrodes. The cEEGrids were fixed around the ear with a double-sided adhesive tape and the ton electrodes were inserted into the earmold up to skin contact after a drop of electrolyte gel was administered into the bores. All electrodes were connected to a wireless mobile 24-channel DC EEG amplifier (SMARTING, mBrainTrain, Belgrade, Serbia; custom modification for cEEGrid acquisition) positioned at the back of the head. EEG data were recorded with 24 bit resolution and 500 Hz sampling rate; electrodes R4a and R4b of the cEEGrid (see Figure 1) served as ground and reference, respectively. Signals were wirelessly transmitted to a recording computer through a Bluetooth connection. Although the used system is a laboratory-state prototype, there is no principal reason that electrodes in this layout cannot be included in a real hearing device or a fully mobile prototype.
A schematic drawing of the recording setup is shown in Figure 2. Acoustic stimulation and experimental control was implemented in MATLAB (Mathworks, Inc, Natick, MA) on the same laptop that was also used to send EEG triggers synchronously to audio stimulation via Lab Streaming Layer, a software framework for data acquisition (Swartz Center for Computational Neuroscience & Kothe, 2015). The subjects including the laptop were seated in a booth that was acoustically but not electromagnetically shielded. The EEG data as well as the event marker sent by the audio processing laptop were recorded using the recording computer located outside the booth using the LabRecorder Software from Lab Streaming Layer.
Schematic depiction of the general experimental setup. The subjects were seated in a booth (indicated by thick gray line), where they conducted the experiments autonomously on a laptop that controlled the stimuli presentation, real-time audio processing for the hearing device, and EEG triggering through LSL.
Paradigm
Participants listened to sequences of four sounds. In each trial, four identical sounds were presented via the headphones. In half of the trials, the filter setting of the hearing device was switched between the third and the fourth sound, resulting in a perceivable deviation. Participants indicated whether they perceived an acoustic difference between the third and fourth sound by pressing buttons (y/n) on a keyboard within 1 s after the end of the fourth sound. Two different filter settings of the hearing device were utilized for each subject; details on the filter design are described in
Since the EEG evaluation assumes the subjects’ attention, data of subjects with a poor task performance were discarded. Only data from subjects whose responses fulfilled the following criteria were included in the analysis: (a) response correct (identical trials indicated as
Stimuli
Three different stimuli were used: White noise (referred to as
Each sound of the Noise condition had a duration of 500 ms. For the Speech-in-Noise condition, the logatome was placed in the middle of the 500 ms noise segment (see Figure 3). For the Speech condition, the logatome was placed at the same point in time as in the Speech-in-Noise condition to keep the speech onset time the same for these two conditions. For the Speech condition, this resulted in a longer period of silence before and after the logatome compared with the Speech-in-Noise condition. One trial consisted of four sounds presented sequentially with an interval of 300 ms between the 500 ms stimulus windows (beginning marked by S1 to S4 in Figure 3).
Temporal recording of acoustic stimuli, obtained in a measurement on a dummy head. The example shows a trial for the Speech-in-Noise stimulus, including a switch from the hearing device output Filter F1 in the first three sounds (S1 to S3) to F2 in the last sound (S4). The blue line indicates the pressure at the artificial eardrum, which consists out of the direct sound leaking through from headphone playback and the output of the hearing device, indicated by the magenta curve (amplitudes not to scale). The different spectral profiles of F1 and F2 change the apparent power of the hearing device output; however, due to interference with the direct sound, the pressure at the eardrum has a similar level with both filter settings. Stimuli are 500 ms long with 10 ms ramps at the beginning and end, and separated by pauses of 300 ms, the range where the Speech stimulus is active is marked separately. O1 to O4 mark the onsets of the hardware noise before the first stimulus and after briefly turning it off between stimuli; S1 to S4 mark the onsets of the stimuli.
The audio stimuli are shown in Figure 3, which shows an example of a Speech-in-Noise stimulus measured at the artificial eardrum of a dummy head. The dummy head consisted of a custom adjustable ear canal simulator (Hiipakka, Tikander, & Karjalainen, 2010) that was attached to KB1065/1066 pinnae (G.R.A.S., Holte, Denmark) and mounted in a modified show-window mannequin. The dummy head was equipped with the same individualized earpieces as the subjects.
Each 16 deviant trials including a filter-switch in both possible orders of the two utilized filters and 16 nondeviant trials in either filter setting were presented. This was repeated for each stimulus (Noise, Speech, and Speech-In-Noise). Thus, in total, 192 trials were presented in randomized order, subdivided in four blocks of the same length. The experiment included additional conditions with a comparable number of trials, the results of which are not considered in this work. One session lasted about 90 min, which included individual adjustments of the hearing device filters prior to presentation of the stimuli (see next section). Prior to each block, the subjects had the opportunity to take a short break while remaining seated.
Hearing Device Settings
The deviation between repeated sounds was created by two different adjustments of the hearing device output filter. In one adjustment, the output filter of the hearing device was adjusted by individual calibration of the hearing device prior to the main experiment (Filter F1, see
A life hearing device was used, which made it almost inevitable to have a perceptible noise floor that originates mainly from the pickup microphone and fills the pauses. If the last sound is different, the output filter of the device is switched between playback of stimuli, whereas the operational setting is kept constant in nondeviant trials. To avoid sudden transient modification in the hardware noise coloration in deviant cases, the hearing device output was briefly deactivated 130 ms after presentation of Sounds 1 to 3 (20 ms pause, with 10 ms ramps, referred to as O2 to O4, see also Figure 3). The length of the deactivation was adjusted such that the pause was as brief as possible, while it still perceptually separated the noise floor before and after in different sound events. The hearing device was activated 300 ms prior to presentation of the first sound of each trial (referred to as O1) and turned off 130 ms after the last sound.
EEG Analysis
The analysis was performed offline with EEGLAB (Delorme & Makeig, 2004) and MATLAB. For the statistical analysis, we used RStudio (RStudio, Inc., Boston, MA), for the planned comparisons regarding the stimulus onsets,
The data from each block were filtered prior to segmentation between 0.1 Hz and 20 Hz with a consecutive high-pass filter (filter order 500) and low-pass filter (filter order 100, windowed sinc FIR filters with linear phase). Epochs were extracted for the entire trial (−1000 ms to 4000 ms) relative to the onset of the first sound (S1). Furthermore, epochs were extracted for the individual sounds (−500 ms to 1000 ms) relative to the onset of the respective Sounds S1 to S4. After first inspection of the results (see also Discussion section), we also extracted epochs of the same length locked to the onsets of the hearing device O1 to O4, that is, the moments when the hardware noise started. Epochs dominated by artifacts were identified using the probability criteria implemented in EEGLAB (standard deviation: 2) and rejected from further analysis. On average, 27.1% (
The main contrast of interest was between identical and deviant sounds (S4). We expected a difference in amplitude of the N100, with a larger amplitude for the deviant compared with the identical condition. In addition, we expected a larger P300 for the deviant sound compared with the identical condition. Furthermore, we expected a decrease of the N100 amplitude from S1 to S2. The amplitude of the N100 was quantified by computing the mean amplitude for a 40 ms window around the N100 peak latency (±20 ms). The N100 latency was calculated as the peak latency of the N100 amplitude in response to S1. The same temporal window with respect to the stimulus onset was used to compute the amplitude in S2 to S4. The amplitude of the P300 was quantified by computing the mean amplitude for the time window of 230 ms to 430, relative to S4 and O4, respectively. Based on prior experience (Bleichner & Debener, 2017), we computed the signal difference between the mean of two electrodes above and the mean of two electrodes below the ear ((R2 + R3)/2) – ((R6 + R7)/2); see Figure 1 for the position of the electrodes. The resulting signal is in the following referred to as vertical bipolar cEEGrid channel and utilized to evaluate the ERPs in response to the switch in hearing device processing. All analyses were performed with the electrodes on the right side, that is, on the ear where the stimuli were presented (cf. EEG setup).
Influence of Electrode Position
A second objective of this study was to compare the signal at different electrode positions in and around the ear. To evaluate this issue, we computed measures of effect size, signal to noise ratio, and between-channel similarities for three different electrode configurations.
Electrode configurations
In addition to the vertical bipolar cEEGrid channel, the signal quality was evaluated for three electrode configurations: (a) all individual electrodes of the cEEGrid referenced to the original reference (Grid), (b) all in-concha electrodes locally rereferenced to the other in-concha electrodes (Concha), and (c) all cEEGrid electrodes rereferenced to the mean of the in-concha electrodes (Grid/Concha).
Effect size
The grand average ERPs (mean over all participants and trials) were computed for identical and deviant sounds relative to O4 for the Speech stimulus. The effect size, that is, the difference between identical and deviant presentation, was measured as Hedges’
SNR comparison
To assess the quality of the ERPs for the N100 response to the first sound (S1), an SNR was calculated for the Speech stimulus in each participant separately. The SNR was computed for the N100 component by dividing the root mean square of the N100 component at peak latency ± 20 ms by the root mean square of the estimated noise in the same time window scaled to dB (20log/10 (signal/noise)). The noise was estimated using a plus–minus procedure (Schimmel, 1967): The time signals of all trials are averaged after the polarity of every other trial is reversed. Assuming a signal that is coherent across repetitions, the resulting average is an estimate of the noise. For each electrode configuration, the individual channel with the maximal SNR was selected for each participant.
Interelectrode correlation
Furthermore, we assessed the influence of the electrode configuration on the between channel similarity. We therefore calculated the between-channel correlation coefficient between the individual channels of the Grid and Concha configurations, and the in-concha electrodes referenced to the recording reference (R4b). As we were interested in the overall signal similarity independent of the task and a specific neural source, all available data of the recording session were used and segmented into epochs of 1 s each. To prevent that the correlation is primarily driven by nonneural artifacts (e.g., eye blinks), epochs that contained artifacts were discarded (EEGLAB joint probability criterion, 2 standard deviations). The correlation coefficient was computed between all channel pairs for each epoch, and then averaged over epochs and participants.
Results
Psychophysical Results
Figure 4 shows the subjective discrimination results as indicated by the individual participants. Generally, identical and deviant trials were recognized with high accuracy. On average, identical sequences were indicated as such in 90.0% of all trials, and sequences where the last sound was deviant were indicated as Subjective discrimination results, pooled over stimuli. For Identical and Deviant trials, the individual subjects’ responses are grouped to equal, different, and none. Data from three subjects (E6, E8, and E13) were excluded from further analysis because at least one of the criteria was not fulfilled: Response correct (i.e., 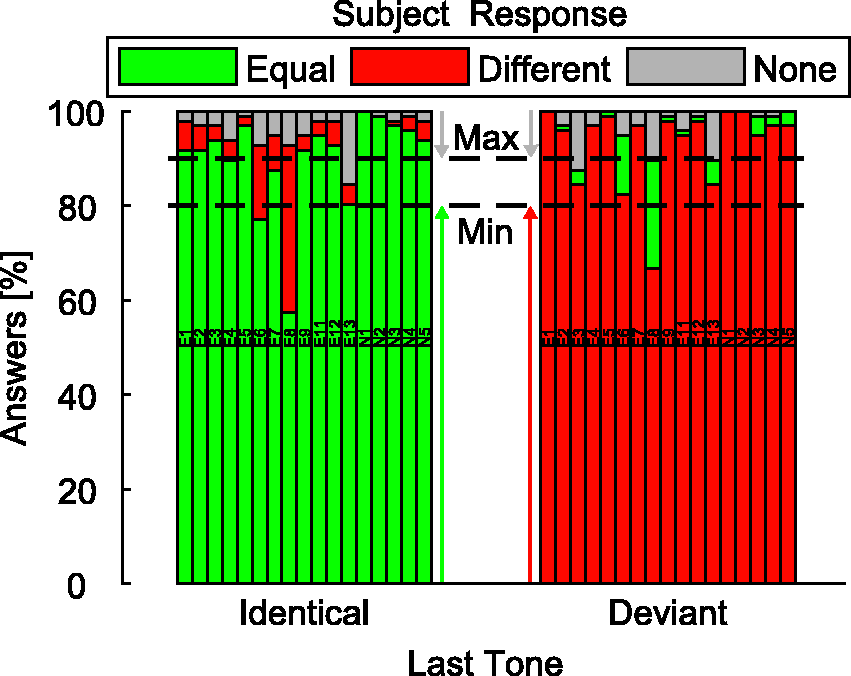
EEG Results
Piloting results
Extensive piloting tests had been conducted where the same ear-EEG setup and the same or a similar paradigm, but varying acoustic stimulation were utilized. In particular, sound presentation was also done on distant loudspeakers only, while the hearing device was in place but disconnected from the sound card. Electromagnetic cross-talk from the hearing device or headphone to the EEG electrodes could thus be ruled out by comparing the EEG recordings from loudspeaker stimulation to the hearing device or headphone stimulation. Generally, the piloting results verified that the stimulus-locked signal components observed in the ear-EEG electrodes do originate from brain activity.
N100 amplitude reduction
The N100 amplitude reduction was assessed for the vertical bipolar cEEGrid channel (see (a) Top: Grand average ERP for Noise (solid line) and Speech-in-Noise (dashed line) condition, combined for identical and deviant trials. Bottom: Grand average ERP for Speech (solid line). Clearly visible is the N100 response roughly 150 ms after sound onset (S1), as well as after the onset of the hardware noise (O1). (b) Grand average ERP for S1 (black), S2 (dark gray), and S3 (light gray) for the Speech stimulus. Indicated in gray is the time window that was used for estimating the N100 amplitude. (c) Grand average ERP for identical (gray line) and deviant filters (black line) for the Speech stimulus (O4). Indicated as a gray background is the time window that was used for estimating the N100 amplitude (first) and the P300 amplitude (second). (a) N100 Amplitude in respect to stimulus onset for S1 and S2 for the individual stimuli. The N100 amplitude is reduced for S2 relative to S1 for all stimuli. (b) N100 amplitude in respect to device onset (hardware noise onset) for O1 and O2 for the individual stimuli. (c) N100 amplitude for identical and deviant condition in respect to device onset (O4) for the individual stimuli. Boxes and whiskers denote the 25% to 75% quantiles and full data range, respectively; the horizontal line indicates the median, circles denote outliers.

Also apparent for all stimuli (Figure 5(a)) is a negative deflection prior to stimulus onset with a latency that fits the onset of the hardware noise when the hearing device is switched on (O1). The N100 amplitude was decreased for the subsequent onsets (O1 to O2). We computed a repeated measures ANOVA on the N100 in response to the device onset with the factors Stimulus Type (Speech, Speech-in-Noise, and Noise) and Sound (O1, O2). The results are shown in Figure 6(b) and are also apparent in Figure 5(b) for the Speech condition. The N100 amplitude is larger for O1 compared with O2, analog to what we found for S1 and S2. However, the main effect of Sound on the N100 amplitude does not reach significance for O1 compared with O2,
Filter switch
The identification of the filter switch is first assessed for signals from the vertical bipolar cEEGrid channel. Regarding the expected N100 amplitude reduction of the S4-identical relative S4-deviant condition, we computed a repeated measures ANOVA with the factors Stimulus Type (Speech, Speech-in-Noise, and Noise) and Filter-Switch (S4-identical and S4-deviant). We find a significant main effect of Filter-Switch on the N100 amplitude,
We also examined the N100 amplitude in response to the device onset (O4) and computed a repeated measures ANOVA with the factors Stimulus Type (Speech, Speech-in-Noise, and Noise) and Filter-Switch (O4-identical, O4-deviant). The results are shown in Figure 6(c) and are apparent for the Speech stimulus in Figure 5(c). We found a significant main effect of Filter-Switch on the N100 amplitude,
Finally, we analyzed P300 amplitudes in response to the device onset and computed a repeated measures ANOVA with the factors Stimulus Type (Speech, Speech-in-Noise, and Noise) and Filter-Switch (O4-identical and O4-deviant). The results are shown in Figure 7 and are apparent in Figure 5(c) for the Speech stimulus. We found the expected significant main effect of Filter-Switch on the P300 amplitude, P300 in respect to device onset (hardware noise onset) at O4 for the individual stimuli, comparison of identical and deviant trials. Over all stimuli, we observe a higher amplitude in the P300 window for the deviant sounds compared with the identical sounds. Boxes and whiskers denote the 25% to 75% quantiles and full data range, respectively; the horizontal line indicates the median, circles denote outliers.
Electrode comparison
The results of the effect size (i.e., difference in ERP between identical and deviant trials on O4) comparison in dependence on the electrode layout are shown in Figure 8(a). The largest effect sizes for the N100 and P300 time window were obtained for the Grid configuration (on average of the individual channels). The Grid electrodes behind and above the ear showed a medium effect size (but below the threshold for (a) Mean effect size (Hedges’ g, absolute values) for the N100 (left) and P300 (right) between conditions (O4, deviant/identical). The color lines from the insets in the center indicate the electrodes and the respective reference. The cross or black line in the Grid condition marks the vertical bipolar cEEGrid channel that has been utilized for the Filter-Switch discrimination in the previous section. The in-concha channels (Concha) were locally rereferenced to the other in-concha channels. The cEEGrid channels (indicated as colored dots) were either rereferenced to the R4b (white electrode with black dot, Grid condition) or to the mean of the in-concha channels (Grid/Concha condition). (b) Maximal SNR (maximum of channels in each condition) for the N100 in respect to the stimulus onset (S1) of the Speech stimulus, individual subjects grouped. The in-concha electrodes were locally rereferenced to other in-concha electrodes (Concha), for cEEGrid channels, references to the below the ear channels or the original reference (Grid), for the Grid/Concha condition the cEEGrid channels were rereferenced to the mean of the in-concha channels.
The SNR analysis of electrodes at different positions and referencing schemes is shown in Figure 8(b). The largest SNR was observed in the cEEGrid electrodes (Grid configuration,
The analysis of the interelectrode correlation patterns is shown in Figure 9(a). For the cEEGrid channels, the median correlation was (a) Between-channel correlation of all around-the-ear and in-concha channels (referenced to electrode R4b). The four below-the-ear (R5 to R8) and above-the-ear (R1 to R4) electrodes are more highly correlated to each other than to the electrodes of the other group. The in-concha electrodes (CLB, CLF, and CU) are highly correlated to each other and largely uncorrelated to the electrodes around the ear. (b) Inter-electrode angle difference (in respect to reference electrode) relative to the inter-electrode correlation. The larger the inter-electrode angle, the lower the inter-electrode correlation (
Discussion
ERPs and Identification of the Filter Switch
We observed robust ERPs in response to the onset of the stimuli, including N100- and P300-like structures that could be exploited to identify a switch in the filter of the hearing device. For the N100, we found the expected amplitude reduction in response to repeated sounds. For a deviant last sound, the expected increase in the N100 amplitude compared with an identical last sound was not present in our data. However, this result can be fully explained by considering the hardware noise of the hearing device. It is important to note that the manipulation of the filter settings in our experiment lead to a change in the spectral properties, both for the actual stimuli and the hardware noise. That is, a filter-switch between S3 and S4 became already apparent at the moment the device was switched back on (O4). To avoid sudden transient of the audible noise floor on a filter-switch, we had decided to briefly switch the hearing device on and off between presentation of stimuli while the filter was switched (or not). The onset of the hardware noise was very salient, particularly the first on-switch prior to presentation of the first sound which lead to a N100 (Figure 5, 100 ms after O1) that was comparable in size to the N100 to stimulus onset (Figure 5, 100 ms after S1). The N100 also showed a reduction in amplitude from the first (O1) to the second hardware noise onset (O2). Most importantly, we did find a difference in the N100 amplitude between identical and deviant trials with respect to the moment when the device was switched back on between O3 and O4. The task for the participants was to detect a difference in the last sound of the sequence and to respond with a button press. The expected difference was not observed in the latency range with respect to the onset of the last sound (S4). The P300, which could be associated with the more conscious detection of the difference of the acoustic properties, was consequently also locked to O4. In conclusion, the EEG results suggest that the decision (deviant/identical) could already be made at the time O4, that is, based solely on the hardware noise of the hearing device. Once the change in the hardware noise was detected, no further auditory processing of the actual stimulus was necessary. It should specifically be noted that the time at which the subject was able to make the decision was revealed purely by the EEG analysis and cannot be resolved based on the present psychophysical data.
The conclusion that subjects made the discrimination based on the hardware noise is supported by the comparison of the ERP amplitudes for the different stimuli. The largest amplitude change for both the N100 and P300 between identical/deviant last sounds is present for the Speech condition. The time between device onset and stimulus onset was largest for this condition. For the Speech condition, the hardware noise was audible for a longer duration and could therefore more easily be used to identify the filter condition. Consequently, the respective ERPs could be estimated more reliably as separate ERPs in response to different sound onsets overlapping to a smaller degree compared with the Noise and Speech-in-Noise condition. Especially in the P300 latency range, the ERP in response to O4 for the Noise and Speech-in-Noise stimuli appears to largely overlap with the ERP in response to S4, leading to small P300 median amplitudes (cf. Figure 7). This also explains the significant dependence of the P300 amplitude in response to O4 on the stimulus, although the sound the response is locked to is independent of the stimulus.
Admittedly, these results were not intended. We aimed to study the influence of the filter settings on the perception of the stimuli, and the hardware noise was regarded as a disturbance. However, our results provide relevant practical insights for future EEG studies regarding aided hearing. The hardware noise of hearing devices is a common issue that can often be neglected for hearing impaired subjects, but becomes relevant in normal-hearing subjects as in this study. Changes in the acoustic properties of the hardware noise are readily perceivable by the participants, leading to unwanted effects that bias the results. Apparently, avoiding transient cues when switching the processing setting by briefly turning off the hearing device were not sufficient to suppress such disturbances. For future similar studies, we recommend to temporally separate any switches in the device operation from stimulus presentations by several hundred milliseconds, such that the cortical responses to both events are temporally separated. If problems specifically originate from audible hardware noise, another option is to additionally present noise that perceptually masks this cue, as successfully applied in Denk et al. (2017).
Signal Quality in the Individual Electrode Positions
The second objective of our study was to compare the signal quality in the around-the-ear and in-concha electrodes. For around-the-ear recordings, we used a cEEGrid, and for the in-concha recording, we used small ton electrodes. We found the larger effect sizes for the switch identification and the better SNRs for the cEEGrid electrodes. Given the effect sizes for the filter switch discrimination, the electrodes above and behind the ear referenced to a behind-the-ear location seem to be most informative.
Regarding the between-channel correlation analysis, we found that the signals recorded at different cEEGrid electrodes show differences in the correlation scores. The between-channel correlation depends on the angle between two electrodes (relative to the reference electrode), the smaller the angle the higher the signals were correlated. This is also in line with earlier studies where we find that different cEEGrid channels are sensitive to different neural sources (Bleichner & Debener, 2017). When referenced against a cEEGrid electrode located behind the ear, the concha channels showed very high between-channel correlations (
The small interelectrode distance in the concha and the small angle between in-concha electrodes relative to the
The observed SNRs were generally higher in the around-the-ear electrodes than in the in-concha electrodes. However, we also found that the SNR of the in-concha electrodes can be as high as the SNR of around-the-ear electrodes in some participants. We used in-concha electrodes that were not tightly integrated with the earmold but were plugged into a bore, in addition to an electrode technology that was different between around-the-ear and in-concha electrodes. These factors might have contributed to the lower SNR for the in-concha electrodes. Another relevant factor could be amplifier noise (Kidmose, Looney, Ungstrup, Rank, & Mandic, 2013). The signal amplitude decreases as the electrode distance decreases, that is, the overall signal amplitude of the concha channels is small. It is hence possible that the amplifier noise (input noise 1 µV, according to amplifier specification) dominated the signal, which could also have led to the observed reduction in SNR. For future work, identical electrode technology should be used to unambiguously compare the SNR between in-concha versus around-the-ear EEG. Furthermore, an amplifier with even lower low input noise should be used to potentially improve the SNR of channels that are spatially close to each other.
Conclusions
We studied the feasibility of using around-the-ear (cEEGrid; Bleichner & Debener, 2017; Debener et al., 2015) and in-concha EEG electrodes integrated with a live hearing device (Denk et al., 2017) to objectively monitor sound perception. Although the used system was a laboratory-state prototype, there is no principal reason that electrodes in this layout cannot be included in a real hearing device. Specifically, we switched the processing settings of the hearing device between repeated sounds and studied the effects on the N100 and P300 waves of the ERPs. Besides the identification of such filter switches in the ERPs, we evaluated the signal quality of around-the-ear and in-concha electrodes.
The results show that high-quality ERPs can be obtained from ear-EEG during hearing device activity without crosstalk from the electroacoustic system. The filter switch of the hearing device could be identified in the ERP responses. The EEG results revealed that the subjects detected the switch already in the hardware noise of the hearing device preceding the actual stimulus, although transient changes were avoided—an issue that should be considered in future applications of EEG together with aided hearing. Importantly, the EEG provided additional insight in the perception process that was not apparent in the current psychophysical data, namely the point in time where the deviation was perceived by the subject.
Signals from in-concha and around-the-ear electrodes were largely uncorrelated and appear to capture nonredundant information. Also, individual around-the-ear electrodes were less correlated among each other than the in-concha electrodes. For the correlation between electrode channels, the position of the reference electrode and the angle between electrode-reference vectors seem to be the most dominant factor, rather than the distance. The achievable SNR appears to be higher in the around-the-ear electrodes than in the in-concha electrodes, although the different electrode technologies utilized here may have biased the result. The effect size for the switch discrimination was larger when only around-the-ear electrodes were utilized than for sole utilization of in-concha electrodes. Altogether, according to our results, an array of electrodes distributed around (most importantly above and behind) the ear, potentially extended by one (or more) electrode(s) in the concha or ear canal, is highly promising for applications in hearing devices.
In summary, our results show that using ear-EEG in combination with live hearing devices is possible. EEG signals acquired in close proximity of the ear contain relevant neural information that may be harvested to realize brain-computer interface technology that is integrated into hearing devices of the future.