
Abstract
Keywords
Introduction
An isovist is defined as the set of all points visible from the given vantage point in space. Despite being originally considered as a three-dimensional concept (Benedikt, 1979), isovists have typically been implemented as 2D or 2.5D computational models of visibility. Recently, however, it has become more viable to compute isovists in 3D. It is therefore timely to consider how the traditional 2D implementation is extended to 3D and what this means to the original meaning of isovists.
A direct extrapolation of the classic 2D method to the third dimension yields an isovist equivalent to the unweighted volume of geometrical space visually accessible from its vantage point (from now on referred to as the
These properties are not identical in the vertical compared to the horizontal plane: our field of view is wider than higher, most of our locomotion happens along the horizontal plane, and we typically care more about the information distributed along the horizontal plane. We perceive space that is
To address this, we investigate the concept of the
A central contribution of this paper is a user study that empirically demonstrates how metrics that quantify the changing relationships between these sub-regions of an embodied 3D isovist capture key distinctions in the subjective visual impression of spaciousness and complexity in various environments. In the user study, the metrics of 3D isovists were systematically varied in prototypical building models, implemented in a Virtual Reality setting. Participants were asked to rate their impressions of those spaces. We hypothesised that the
Background
The concept of the
Embodied perception and related limitations of the generic volumetric 3D isovist
Human perception is
The organisation of the visual system is also asymmetric: our visual field is wider than higher (Strasburger and Pöppel, 2002). People do not visually scan the entire environment in equal proportions since the majority of relevant information during locomotion (e.g. identifying available navigational alternatives) appears along the horizontal axis, and not the vertical axis (Emo, 2018; Tatler and Land, 2011; Wiener et al., 2012). This is the reason why a 2D isovist analysis performed on the horizontal plane can explain so much of human perception and behaviour. However, when there arises the need to consider the visibility of space on the vertical plane, a direct extrapolation of the logic behind the 2D isovist in the form of the generic It treats 1 unit of vertical space as equal to 1 unit of horizontal space. It treats 1 unit of space above the vantage point as equal to 1 unit of space below it.
In consequence, the generic volumetric 3D isovist computation does not fulfil the same function as its 2D predecessor was envisioned to: it does not represent the amount of information relevant to a human visitor standing at its vantage point. It therefore cannot accurately model human perception of space. Thus, a 3D isovist derived by (naively) extrapolating from its 2D counterpart may limit the accuracy of isovist analysis in the studies of human perception inside 3D environments. We investigate a cognitively motivated extension of the 3D isovist that accounts for these phenomena.
Although locomotion is a core component of the human visual system, in the present study we focus on visibility from a
New model: Embodied 3D isovist
Definition
We define the embodied 3D isovist that enables the analysis of three-dimensional space grounded in the way humans perceive and explore information present in the visible shape of that space (Bhatt et al., 2012; Bhatt and Schultz, 2017; Kondyli and Bhatt, 2018; Krukar et al., 2017). In this section, we present an operationalisation of the concept. We then demonstrate how the embodied 3D isovist differentiates between features of architectural space unaccounted for within the classic 2D and the generic volumetric 3D isovist approaches. We present a summarised definition below and in Figure 1. Please refer to supplemental material 1 for details. Our operationalised definition is based on the following steps:

The construction of the embodied 3D isovist: (a) Wall surfaces (green) are considered as equivalent, floors and ceilings (blue and red) are considered to be distinct surfaces. Together with the vantage point, oriented surfaces are used to define the volume of a figure constituting each directional part of the 3D isovist; (b) A schematic (not to scale) representation of the relation between the
Step (1): Partition all opaque surfaces in the environment into triangles.
Step (2): For each triangle
Step (3): Triangulate each visible region
Step (4): Each triangle in each
Step (5): Calculate the volumes of three-dimensional figures defined by the isovists’ vantage point and the three types of surfaces (all walls, all floors and all ceilings).
Measures
In the previous section, we divided the isovist volume into semantically distinct regions based on the orientation of visible surfaces. We will now define relations
Consider a cube with an isovist vantage point located in its centre. This defines six identical pyramids which share one apex. Each wall, floor, and ceiling surface defines the base of a single pyramid. The 
We refer to pyramids with a floor or ceiling base as 

A person 170 cm tall, standing in a room of 2.5 m height, will have their vantage point (eyes) located above the room’s centre yielding the 
In most common everyday situations, human height above the floor is fixed and rooms are rarely lower than 2.5 m. Therefore, 
This reflects the perceived verticality of the larger space. Neither of these numbers change when the observer moves into the corner of the cube. Similar to the measurands proposed by Benedikt (1979) for 2D quantification, additional values can be obtained to reflect the position of the vantage point with respect to the boundaries of such a figure, e.g. based on the length and variance of distances to the isovist’s boundaries. These are not explored in detail in the current article.
Jointly, the
A common analytical scenario in architecture is patios with vistas opening into multiple floors or balconies. Consider a simplified environment presented in Figure 1(d). The proportion of horizontal information available to the viewer is limited, quantified as the relative volume of the horizontal pyramids. Therefore, the
The next measure addresses this issue. Distinguishing between very high and narrow, but convex spaces and those which are low but have many vertical occlusions is possible with 
Empirical evaluation: Predicting human perception of space with 3D isovists
In order to evaluate our 3D embodied isovist model in comparison with the generic volumetric 3D isovist model, we designed an experiment in which participants were asked to provide impressions about the surrounding space from multiple vantage points inside diverse building models. Inspired by the earlier findings of Wiener et al. (2007) and Stamps (2011), we asked participants to rate
Hypotheses
We hypothesised that the embodied 3D isovist properties will better correlate with the impressions of
Participants
Thirty voluntary participants (8 female and 22 male, aged between 20 and 30 years) were recruited from the local university. Each participant signed an informed consent form in accordance with the institute’s ethical clearance policy. They were warned that the study takes place in a virtual reality setting which might cause nausea. It was emphasised that they are free to take a break or quit the experiment at any time.
Materials
The study was implemented in a virtual reality setting. Subjective impressions provided within virtual reality have been shown to correspond well with impressions that participants have in real architectural spaces (Kuliga et al., 2015) (but note that virtual reality has also been shown to produce compressed distance estimates (Renner et al., 2013)). We used SteamVR plugin and Unity 2018.2.4f1 to program the experiment. The camera in Unity that renders the scene was set to perspective projection with a vertical field of view of 60°. Participants viewed the space through a head-mounted display HTC Vive Pro (resolution: 1440 × 1600 pixels per eye; refresh rate: 90 Hz; vertical field of view: 110°; horizontal field of view: 110°). They were free to move their head but were not allowed to walk.
Nine three-dimensional building models were created using SketchUp 2018 software. Between 1 and 3 vantage points were selected for testing within each building, resulting in 23 vantage points in total. They were chosen in a way that covers a broad spectrum of possible isovist shapes and sizes as well as corresponding spatial experiences. As we are interested in studying solely the effect of the buildings’ geometry, the models had minimal windows, furniture, and ornamental features. All buildings, together with the selected vantage points, are presented in supplemental material 2. We developed a custom-built EmVis software tool within the InSpace3D framework (Schultz and Bhatt, 2013) and used this to calculate properties for both the embodied 3D isovist and the generic volumetric 3D isovist.2
Spaciousness and complexity rating tasks
Following the procedure used by Stamps (2011), we asked the question: ‘Please rate on the criterion of how not spacious (1) and spacious (8) the building appears from your current position in the building’ as well as ‘Please rate on the criterion of how not complex (1) and complex (8) the building appears from your current position in the building’. In order to provide participants with common reference understanding of spaciousness and complexity, prior to the experiment, they were presented with images showing sample not spacious/averagely spacious/spacious, as well as not complex/averagely complex/complex architectural spaces. During the experiment, participants always heard the question verbally and also provided their rating verbally, on a scale ranging from 1 to 8.
Experimental design and procedure
The experiment followed a within-subject design: each participant provided responses to all three tasks, from all 23 vantage points. The order at which participants were shown each space was randomised. The randomisation algorithm included a rule preventing two vantage points from the same building to be shown directly after each other (at least two other vantage points would always be presented in between). This rule was implemented to prevent the participants from thoughtlessly carrying over the ratings from one vantage point to another, after realising that it is located in the same building.
After fitting and calibrating the head-mounted display, participants were shown a trial building. They were asked to verbally (1) provide the spaciousness rating, (2) provide the complexity rating and (3) perform distance estimation (see supplemental material 3 for details). After the trial, the procedure was repeated for all other vantage points, in a randomised order. Figure 2 presents sample views of the environments.

Views from the virtual building models, as they were seen in a head-mounted display by experiment participants. (a) Vantage point ‘S’ in building ‘Pillared’. (b) Vantage point ‘Q’ in building ‘Office building’ during the distance estimation task (a blue cube is visible near the staircase). (c) Vantage point ‘G’ in building ‘Eight shaped’. (d) Vantage point ‘I’ in building ‘Library’. (e) Vantage point ‘H’ in building ‘Library’. (f) Vantage point ‘A’ in building ‘Boxing ring’.
Results
Table 1 lists all vantage points presented to the participants, together with their corresponding isovist properties. We hypothesised that the
Summary statistics for each vantage point from the study.

The brackets in column names indicate whether a given variable was used as a
Statistically, this general hypothesis can be expressed as the model comparison problem: It is possible to construct alternative statistical models to explain
We implement Bayesian multi-level models (McElreath, 2018) in the brms R package (Bürkner, 2017), which is based on Stan (Carpenter et al., 2017). We interpret and highlight the effect of each predictor on the outcome variable as highly significant if its 95% Credible Interval excludes 0. All models contain a by-participant random intercept and random slopes. Therefore, models consider the fact that responses coming from each participant are likely to be correlated with other responses of this participant. Model comparison is conducted using the brms::loo_compare method. LOO greater than twice its standard deviation suggests that the model with lower LOO fits the data better – we highlight such differences as significant.
Compared to Table 1, we transformed some of the variables to facilitate model fitting:
Predictors listed in Table 1 can be used to generate 30 alternative combinations. We tested all possible 30 combinations for each of the two dependent variables, implementing 30 × 2 = 60 models. For each dependent variable, we present the simplified comparison between the best-performing
Spaciousness
Responses to the
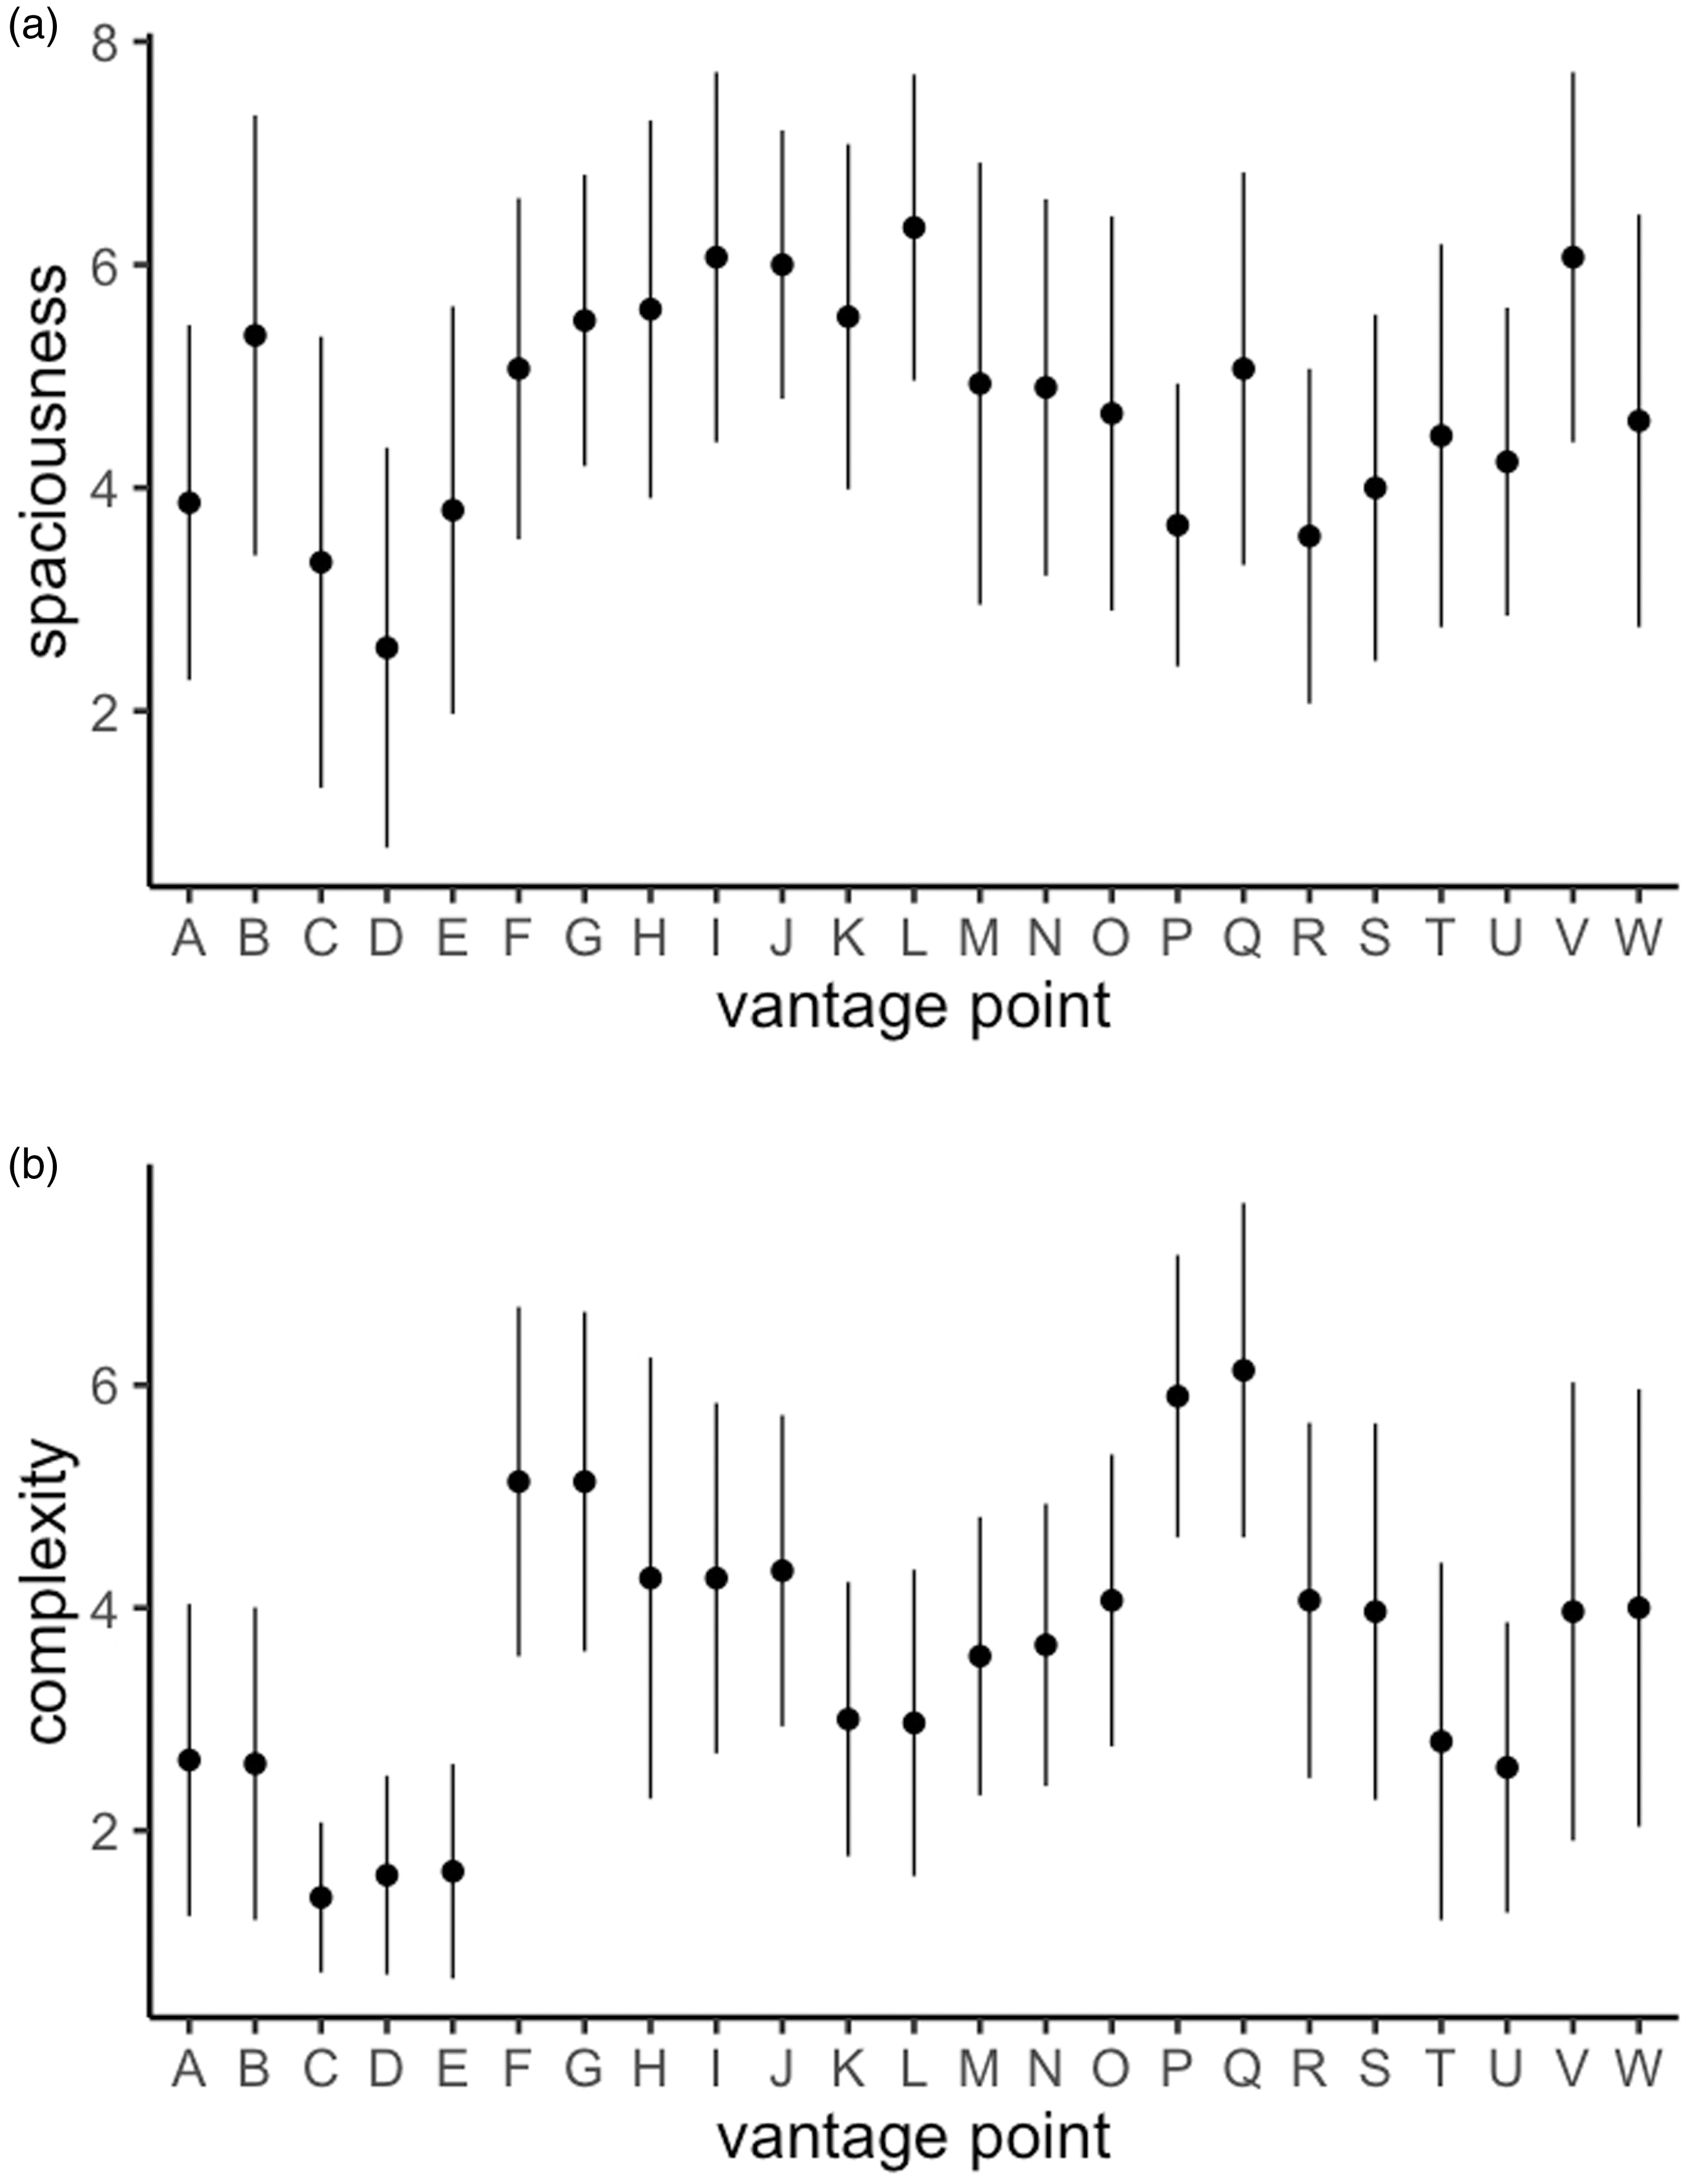
Raw data from (a)
LOOIC comparison of the best-performing

For a full formula of each model, refer to its name in supplemental material 4.Significance marked with ‘∗∗∗’ when the 95% CI excludes 0.difference in LOOIC (second column) is larger than twice its Standard Error (thrid column).
Posterior mean estimate, standard error and 95% credible interval for each parameter of model ‘spaciousness.emb.23’ with a varying intercept and varying slopes by participant.

Significance marked with ‘∗∗∗’ when the 95% CI excludes 0.
Complexity
We repeated the procedure from the previous section to analyse the
Model ‘complexity.emb.21’ explained the data best. It was also significantly better than the best-performing
LOOIC comparison of the best-performing

For a full formula of each model, refer to its name in supplemental material 4.Significance marked with ‘∗∗∗’ when difference in LOOIC (second column) is larger than twice its Standard Error (third column).
Posterior mean estimate, standard error and 95% credible interval for each parameter of model ‘complexity.emb.21’ with a varying intercept and varying slopes by participant.

Significance marked with ‘∗∗∗’ when the 95% CI excludes 0.
Lastly, we considered the possibility that other isovist measures (untested here) might have a significant impact on spaciousness and complexity ratings. This analysis demonstrated no impact on our conclusion and it is presented in supplemental material 5.
Discussion
We presented a user study investigating a cognitively motivated extension of the 3D isovist. Results of the empirical experiment consistently demonstrated that the embodied 3D isovist is a more reliable predictor of the human perception of space compared to generic volumetric 3D isovists. Statistical models including the newly proposed measurands outperformed statistical models based on the generic volumetric 3D isovist calculations. In our study, participants’ ratings were correlated not only with already known predictors of
This extends the existing body of knowledge on the perception of
Our findings add to the growing body of evidence supporting the embodied nature of the architectural experience (Jelić et al., 2016; Mallgrave, 2013; Waller, 2014). This aligns with earlier work emphasising explicit links of Space Syntax methods with human perception and cognition (Conroy Dalton, 2005; Penn, 2003). The empirical validation of the embodied 3D isovist model extends the logic behind, and the practical aim of, the original isovist: to describe spatial information relevant to a potential human occupant of space.
Our contribution goes beyond the traditional one-to-one mapping of correlations between a spatial measurand and a psychological response, by testing 30 combinations of predictors (statistical models) and selecting those that perform best in predicting the human-generated data. The presented method makes it possible to select a subset of measurands that combines a high predictive power with a low number of predictors. This has practical implications when one is interested in predicting the potential perception of space with a limited number of isovist measurands: a smaller number of measurands is easier to control and manipulate during the design process. Finding combinations of isovist measurands that are simple but effective is therefore an important practical challenge that determines the potential usefulness of the described methods in the design practice.
In his review of the contribution of Space Syntax to environmental psychology, Montello (2007) points to limitations of isovist analysis. Applying a ‘one-size-fits-all’ visibility representation falls short of accounting for known contextual and interpersonal differences in perception of space. In this paper, we argue that accounting for direction is one of the required building blocks for a concept that Montello calls ‘weighted’ or ‘probabilistic’ isovists – a representation that not only conveys what is possible to see, but what is likely to be seen (by differing groups, in differing contexts).
Related work
Isovists as predictors of human perception
Researchers studied whether isovists can explain human subjective impressions of visible space from a single vantage point. Stamps (2009, 2011) conducted a series of experiments in which participants were asked to rate streets and buildings for perceived spaciousness, in static and dynamic virtual simulations. He found that horizontal area is the strongest predictor of spaciousness ratings and that street views of the same total area can be rated differently, depending on their particular shape (Stamps, 2011). In his earlier work, Stamps linked isovist properties with perceived enclosure (Stamps, 2005) concluding that area and jaggedness (which he terms
Wiener et al. (2012), and later Emo (2014), demonstrated that the geometry of architectural space visible from a single vantage point also explains the preferred choice between two alternative routes, as well as the eye movement of navigators perceiving these alternatives. The analysis demonstrated that vertical information, mostly containing floor and ceiling surfaces, was only sparsely explored by the navigators.
Isovist implementations: 2D, 2.5D and 3D
Methods to model the extent of space visible from a pre-defined vantage point were developed within two different disciplinary perspectives: as ‘isovists’ in the architectural context, and as ‘viewsheds’ in landscape planning. Despite isovists and viewsheds being considered as three-dimensional on a conceptual level, their early computational implementations were two-dimensional.
Limited by the availability of three-dimensional data, researchers utilised digital elevation models in 2.5-D visibility analysis. This approach only accounts for a single
The availability of new methods for sampling and storing three-dimensional data (e.g. Building Information Modelling and LiDAR) accelerated work on three-dimensional isovist implementations. Derix et al. (2008) presented a set of methods for calculating three-dimensional visibility inside architectural spaces. Based on the idea of the visibility graph (Turner et al., 2001), these methods quantify the changes in how open or constrained the space might seem to a potential navigator. Lonergan and Hedley (2015) provide a review of recent approaches to modelling three-dimensional visibility.
Considering the type of space belonging to an isovist, Fisher-Gewirtzman (2016) presented a 3D visibility model which accounts for the semantic property of visible parts of the urban environment, such as roads or trees. Dalton and Dalton (2015) considered the challenge of representing 3D isovists, which becomes especially problematic when different subregions and the semantic content of the visible space is of interest.
Varoudis and Psarra (2014) extended the traditional visibility graph approach to the third dimension by accounting for accessibility affordances of floors. Their approach begins with defining ‘accessible’ and ‘inaccessible’ spaces in the layout, which are represented as a three-dimensional grid of isovist vantage points (for a similar approach, see Lu et al., 2019). A ‘mixed’ visibility graph consisting of undirected and directed edges is then generated. Classical ‘undirected’ edges are created between nodes representing locations which can serve both as origin and as destination of a potential observer ‘looking out’ towards the other node; ‘directed’ edges represent connections between two spaces, of which only one can serve as a potential destination. This can reflect a situation when the observer looks at a void, high in the air above the floor’s surface. This approach goes beyond a simple generic
Limitations and conclusion
The paper demonstrated the validity and advantages of the embodied 3D isovist in accounting for the perception of space of building users.
Both the computational implementation of the concept and its empirical validation are limited and deserve further work. Firstly, the current paper considered only a case of a single vantage point and did not describe the relations between individual vantage points, as it is customary in the Visibility Graph Analysis (Turner et al., 2001). By providing the computational definition of the embodied 3D isovist, we hope it can be extended to the graph-based configurational analysis of visibility in space. Furthermore, although participants in the present study could look around in the VR environment they were positioned at a stationary location, and thus
Secondly, the impact of colour and lighting on the elicitation of spaciousness and complexity was not taken into account. Numerous studies have demonstrated the impact of colour on subjective impressions of interior environments (Flynn et al., 1979; Yildirim et al., 2011).
Lastly, our embodied 3D isovist treats space to the left and to the right of the occupant as equivalent. It bears noting that in some contexts this assumptions is not true: people’s handedness has been linked to the judgement of positively versus negatively associated locations in space (Brunyé et al., 2012). Similarly, our model does not distinguish between the space in front and behind the occupant, which is an important aspect of how people perceive space (Montello, 2007; Tversky, 2009). Our presumption is that these effects are less important in the cumulative judgement of a building’s
1One might be tempted to consider the relationship between the volumes of vertical and horizontal pyramids. However, this does not usefully reflect the shape of an environment. For example, in a unit cube the ratio of the volume of vertical and horizontal pyramids is
2The EmVis software tool, as well as the dataset and all supplemental material, are available for download from https://osf.io/qvkwz/.
Supplemental Material
sj-pdf-1-epb-10.1177_2399808320974533 - Supplemental material for Embodied 3D isovists: A method to model the visual perception of space
Supplemental material, sj-pdf-1-epb-10.1177_2399808320974533 for Embodied 3D isovists: A method to model the visual perception of space by Jakub Krukar, Charu Manivannan, Mehul Bhatt and Carl Schultz in EPB: Urban Analytics and City Science
Supplemental Material
sj-pdf-2-epb-10.1177_2399808320974533 - Supplemental material for Embodied 3D isovists: A method to model the visual perception of space
Supplemental material, sj-pdf-2-epb-10.1177_2399808320974533 for Embodied 3D isovists: A method to model the visual perception of space by Jakub Krukar, Charu Manivannan, Mehul Bhatt and Carl Schultz in EPB: Urban Analytics and City Science
Supplemental Material
sj-pdf-3-epb-10.1177_2399808320974533 - Supplemental material for Embodied 3D isovists: A method to model the visual perception of space
Supplemental material, sj-pdf-3-epb-10.1177_2399808320974533 for Embodied 3D isovists: A method to model the visual perception of space by Jakub Krukar, Charu Manivannan, Mehul Bhatt and Carl Schultz in EPB: Urban Analytics and City Science
Supplemental Material
sj-pdf-4-epb-10.1177_2399808320974533 - Supplemental material for Embodied 3D isovists: A method to model the visual perception of space
Supplemental material, sj-pdf-4-epb-10.1177_2399808320974533 for Embodied 3D isovists: A method to model the visual perception of space by Jakub Krukar, Charu Manivannan, Mehul Bhatt and Carl Schultz in EPB: Urban Analytics and City Science
Supplemental Material
sj-pdf-5-epb-10.1177_2399808320974533 - Supplemental material for Embodied 3D isovists: A method to model the visual perception of space
Supplemental material, sj-pdf-5-epb-10.1177_2399808320974533 for Embodied 3D isovists: A method to model the visual perception of space by Jakub Krukar, Charu Manivannan, Mehul Bhatt and Carl Schultz in EPB: Urban Analytics and City Science
Footnotes
Acknowledgements
Declaration of conflicting interests
Funding
ORCID iD
Biographical notes
References
Supplementary Material
Please find the following supplemental material available below.
For Open Access articles published under a Creative Commons License, all supplemental material carries the same license as the article it is associated with.
For non-Open Access articles published, all supplemental material carries a non-exclusive license, and permission requests for re-use of supplemental material or any part of supplemental material shall be sent directly to the copyright owner as specified in the copyright notice associated with the article.