
Abstract

Keywords
Introduction
In October 2023, the North Carolina Department of Health and Human Services (NCDHHS) began an investigation to determine the source of elevated blood levels of lead (Pb) in four children. The NCDHHS determined the source of the Pb was from apple cinnamon fruit puree pouches (ACFPPs). The investigation conducted by the ACFPP manufacturer identified cinnamon as the potential source of Pb contamination used to manufacture the finished product. The cinnamon used in the finished product was supplied by a company operating in Ecuador. The U.S. Food and Drug Administration (FDA) conducted an onsite investigation and collected bulk cinnamon samples from lots that were used in the Pb-contaminated finished product. These samples collected as part of the inspection were initially analyzed by the FDA and found to contain high levels of Pb and Cr. Additional details regarding the investigation are described in a separate publication. 1
The media attention regarding the contamination of Pb and Cr as reported in ACFPPs has further increased interest in minimizing toxic elements, in particular Pb, in foods. Determining the form of the toxic elements (i.e., inorganic compounds) in an adulterated sample can be useful in identifying the source(s) of the contamination. Common Pb sources include house paint, 2 gasoline, 2 and water pipes. 3 Cr can derive from anthropogenic sources, including mining and smelting waste, as well as naturally occurring terrestrial sources like rocks and sediments. 4 Upon entering the environment, Pb and Cr can contaminate ground water and soil, eventually finding their way into foods. The prevalence of Pb in foods has been extensively documented, as it can enter the food supply during processing, handling, and packaging. 5 In general, Pb concentrations in commonly consumed foods are <0.1 µg/g, 6 and while environmental contamination can increase these levels, concentrations greater than 10 µg/g Pb are uncommon. Several commodities including supplements, remedies, foodware, and spices have been found to contain higher levels of Pb. 7 There are multiple literature reports of even more elevated levels of Pb in spices,8–10 with evidence to support intentional adulteration in some cases.11–13 The following represent the maximum Pb levels detected in their respective studies: 1090 µg/g in cumin, 8 20 000 µg/g in Kviteli Kvavili (Georgian saffron), 10 1150 µg/g in turmeric, 11 and 432 µg/g in turmeric. 12 Spices may be intentionally adulterated to enhance the color and/or increase the product mass.12,14,15
Since there is no acceptable safe level of Pb present in foods, Pb contamination poses concerning health risks, including neurodevelopmental effects (especially in children), fertility issues, and hypertension, among other conditions. 5 Cr toxicity depends on its form, of which hexavalent chromium (Cr(VI)) has been shown to be carcinogenic and can cause other detrimental health effects, 16 while trivalent chromium (Cr(III)) is an essential mineral present in many foods. 17
To assess levels of Pb and Cr in spices, there are multiple methodologies including, but not limited to, spot/colorimetric tests, 18 energy dispersive X-ray fluorescence (ED-XRF), 10 laser induced breakdown spectroscopy (LIBS), 19 inductively coupled plasma optical emission spectroscopy (ICP-OES), 20 and inductively coupled plasma mass spectrometry (ICP-MS). 21 These techniques are focused on determining the total elemental concentrations of Pb and Cr. Liquid chromatography coupled to ICP-MS (LC-ICP-MS) may be used for determining individual species of elements, such as Cr(VI) versus Cr(III). 22 To discriminate among various Pb- and Cr-containing inorganic compounds, molecular spectroscopic techniques, such as Fourier transform infrared (FT-IR), Raman spectroscopy or X-ray diffraction (XRD), are needed. 23
Fourier transform IR and Raman spectroscopy are complementary techniques, and each provides unique spectroscopic information of inorganic compounds.24–26 Because inorganic compounds have defined crystal structures, FT-IR and Raman spectroscopy readily allow for the identification of these compounds. The type and interaction between the cations and anions that form inorganic compounds will generate unique FT-IR and Raman spectra allowing for their identification. For example, if the anion remains constant but the cation is changed, the FT-IR and Raman spectra will change allowing for differentiation of inorganic compounds with the same anion but different cations. The same is true if the cation remains constant and the anion is changed.25,27 Although both FT-IR and Raman are useful in identifying inorganic compounds, Raman offers advantages over FT-IR, including nondestructive analysis, analysis of small particles/crystals (<10 µm), narrow band shapes to resolve overlapping peaks, and collection of spectral information below 500 cm–1, allowing observation of different crystal lattice forms. Compared to FT-IR, Raman spectroscopy can be better suited for identifying and differentiating similar inorganic compounds and mineral species either neat or in mixtures. 24
Therefore, analyzing the bulk cinnamon or isolating particles from cinnamon provides the most useful means of determining specific inorganic compound structure and bonding environment. Combining complementary elemental (ICP-MS) and molecular (Raman) data would be ideal; however, because Raman spectroscopy typically has a much higher detection limit than the previously mentioned elemental techniques, this combined approach is not common. Specifically, the detection limits for Pb and Cr for ICP-MS and ED-XRF are in the sub-parts per billion (ppb) range and parts-per-million (ppm, µg/g) range, respectively, while previous work using Raman to examine lead (II) chromate in turmeric reported detection limits of 0.6% w/w (6000 µg/g) in turmeric powder. 9 However, it should be noted that the limit of detection can be affected by several factors such as instrumentation, sample matrix, and analyte of interest. The sample matrix can have a significant impact on the Raman limit of detection, especially when dealing with food or plant-based matrices. 28 In most cases, inorganic compounds exhibit very strong Raman spectra, but this may be negated by the type of matrix and how the suspect compound is incorporated into the matrix. In these instances, physical separation of individual particles or groups of particles from the matrix may be necessary to detect the adulterant.
Analyses by North Carolina State Laboratory of Public Health (NCSLPH) using ICP-MS found Pb/Cr ratios of 1:1 in several ACFPP samples. 29 Through FDA- and CDC-based investigations,30,31 two ground cinnamon samples determined to be used in aforementioned ACFPP products were collected and sent to FDA laboratories for additional analysis. The focus of this manuscript is the in-depth analysis and characterization of the two ground cinnamon samples to determine the source of Pb and Cr contamination.
Experimental
Materials and Methods
The bulk cinnamon samples related to the previously discussed ACFPPs were obtained as part of the FDA investigation and were suspected to be the source of the Pb and Cr. Two batches of cinnamon were collected from Manufacturer A (for additional information see Cataldo et al. 1 ). The sub portions for each batch were composited by the FDA's Kansas City Human and Animal Food Laboratory (KCHAFL) and were designated as Cinnamon Sample A and Cinnamon Sample B. A commercial source of cinnamon was purchased locally by the FDA's National Forensic Chemistry Center (NFCC) as a control/comparison sample.
Reagents and Standards
For all experiments, water used was derived from a water polishing system (Milli-Q EQ 7000, Millipore Sigma, USA) to deliver ultrapure deionized (DI) water with a resistivity of at least 18.2 MΩ·cm. Optima grade nitric acid and hydrochloric acid were obtained from Thermo Fisher Scientific (USA). Hydrogen peroxide (30% v/v) was obtained from GFS Chemicals, Inc (USA).
For ICP-MS analysis, custom multi-element standards that included Pb and Cr at 10 µg/mL (NFCC) and 10 µg/mL Pb and 20 µg/mL Cr (KCHAFL) obtained from Inorganic Ventures (USA) were used for external calibration standard preparation with a separate production lot from the same vendor representing an independent quality control standard. An online internal standard was used to monitor instrument drift by KCHAFL and NFCC. KCHAFL used an internal standard prepared by diluting a custom stock solution of 40 µg/mL Ge, Sc, 20 µg/mL Au, Ir, Y, 10 µg/mL Rh, and 5 µg/mL Bi and In (Inorganic Ventures) by a factor of 1000 using 1% HNO3, 0.5% HCl, and 4% isopropyl alcohol (v/v). NFCC used a stock standard solution (Inorganic Ventures) containing 10 µg/mL Rh diluted 1000× using 5% HNO3 (v/v). National Institute of Standards and Technology (NIST) Standard Reference Material (SRM) 1643f: Trace Elements in Water and DORM-5 Fish Protein Certified Reference Material (National Research Council, Canada) were used as additional quality control to verify the accuracy of the external calibration curve.
For analysis at the NFCC, three lead (II) chromate standards, designated PbCrO4 Standard A, B, and C were obtained from Thermo Fisher Scientific, Santa Cruz Biotechnology (USA), and Sigma-Aldrich/Honeywell (USA), respectively.
ICP-MS Analysis of Bulk Cinnamon Samples
The purpose of the initial analysis of cinnamon Samples A and B was to confirm the suspected Pb and Cr levels based on various laboratory results from FDA's state public health partners that tested the ACFPPs.1,29–31 KCHAFL analyzed cinnamon Samples A and B using FDA's Elemental Analysis Manual method 4.7 (EAM 4.7), 21 which utilizes microwave assisted extraction, followed by appropriate dilution, and analysis by ICP-MS. A Milestone Ultrawave (Milestone Inc., Italy) microwave system and an Agilent 7900 (Agilent Technologies, USA) ICP-MS were used. Both instruments used parameters described in EAM 4.7, which are summarized here. Five mL of ultrapure HNO3 and 1 mL of H2O2 were added to each sample and digested in the microwave using a temperature ramp to 250 °C over 20 min with a hold for 10 min. Samples required additional dilution, with a final dilution factor of 3–5 × 10⁵ (described in more detail later). The DORM-5 certified reference material was analyzed in tandem with the samples. The hardware used with the ICP-MS included an SPS4 autosampler, a concentric nebulizer, and Scott-style (double-pass) spray chamber, with He used as a collision cell gas. Additional information regarding ICP-MS instrument parameters are included in the supplemental information (Table S1, Supplemental Material).
Based on the total Pb and Cr levels found in the ACFPP samples tested by state public health partners and the estimated amount of cinnamon commonly included in ACFPPs, it was anticipated that the Pb and Cr levels would be significantly higher than commonly encountered during routine analyses using EAM 4.7, which required two considerations. The first being that samples would need to be significantly diluted beyond the typical 100–200 dilution factor as outlined in EAM 4.7. Additionally, microwave vessels used for digestion would likely need to be discarded after use as the high levels of Pb would prevent the vessels from being used for future analysis of Pb at the more commonly encountered lower levels (ppb range).
Optical Microscopy and Raman Microspectroscopy
Following quantitation of Pb and Cr in Cinnamon Samples A and B at KCHAFL, the samples were transferred to the NFCC for additional analyses to determine if the Pb and Cr were present as lead (II) chromate. Based on the previously discussed advantages of Raman over FT-IR in the analysis of inorganic compounds, Raman microspectroscopy was chosen to analyze the cinnamon samples. The non-destructive nature of this technique also allows for particles and material isolated to be retained as a reserve or analyzed by additional instrumental techniques (e.g., ICP-MS).
Prior to performing Raman analysis, both samples were first visually examined using an alternate light source (ALS) (Foster + Freeman Video Spectral Comparator, UK) and optical microscopy (Zeiss Discovery v.8 Stereo Light Microscope (SLM), Germany; Olympus BX51 Polarizing Light Microscope, Japan). The samples were then analyzed using FT-IR spectroscopy using a iS50 FT-IR (Thermo Nicolet, USA) with a MicromATR Vision diamond attenuated total reflectance (ATR) attachment (Czitek, USA), to assess the presence of other adulterants (e.g., starch, cellulose). The FT-IR and microscopic analysis of the samples allowed for a full characterization of the sample matrix while also determining if other adulterants would interfere with the Raman analysis (e.g., materials that would exhibit strong fluorescence). It was determined that, in addition to Pb and Cr being present in the two cinnamon samples, both samples also contained wheat starch. Although the samples contained wheat starch, its presence did not interfere with the Raman analysis.
The bulk cinnamon samples, particles isolated, and standards were analyzed using an XploRa Plus bench top Raman microscope (Horiba, USA). Due to fluorescence issues with the samples using 638 nm laser excitation, the Raman spectra were collected using a 785 nm laser with either a 100× or 20× objective, 100 µm confocal hole, 100 µm slit, 1200 l/mm grating, with an initial spectral range of 50–1400 cm–1 and the integration time and the average number of scans varied depending on the initial Raman response. For the standards, a small amount of each lead (II) chromate standard A, B, and C was placed on a quartz slide and pressed flat using a micro spatula. A Raman spectrum of each standard was collected using the same data acquisition parameters as the samples but with the following modifications. A 638 nm laser, a 20× objective, and a spectral range of 50–3600 cm–1. Due to the strong Raman spectrum of lead (II) chromate, the integration time was 1 s and the average of 10 scans. The standard and sample spectra were baseline corrected using a multipoint baseline correction function in the LabSpec (v.6, Horiba, USA) software.
The bulk suspect cinnamon powders consisted mainly of conglomerates of fine particles and plant material. Since lead (II) chromate is a bright yellow color, it was expected that it would be easily observed in the presence of the cinnamon using SLM. Using SLM with reflected and oblique lighting, the conglomerates were broken apart using a micro needle and particles of interest (i.e., appearing yellow) were physically isolated on a slide and analyzed with Raman microspectroscopy. After the initial analysis of the bulk powders using Raman microspectroscopy, further methods were necessary to isolate suspected lead (II) chromate particles. This included dispersing the bulk powder to further break up the conglomerate material, as the micro needle technique was not sufficient. This was done by adding several drops of DI water to the bulk cinnamon on a glass slide and using a fine tipped probe to disperse and break apart the conglomerate material. The dispersed material was allowed to air dry overnight. Using SLM, particles of interest were again isolated and analyzed using Raman microspectroscopy. Based on the results obtained from the water dispersal method, further improvements were desired, therefore an alternative methodological approach (see schematic in Figure 1) was developed to isolate and concentrate single crystals or aggregates of lead (II) chromate. For this, ∼10 mL of DI water was placed in a 50 mL conical centrifuge tube and ∼0.1 g of bulk cinnamon was placed on the surface of the water and allowed to sit undisturbed for 5 min. Material which had dropped to the bottom of the tube was removed using a pipette, deposited on a glass slide, and allowed to air dry covered overnight. The isolated material was visually examined using SLM, and particles of interest were analyzed by Raman microspectroscopy. The slides were then transferred for ICP-MS analysis.

Diagram for sample preparation used to isolate PbCrO4 particles from the cinnamon sample (density separation method). Figure not to scale; residual cinnamon material was co-transferred with PbCrO4 particles but is omitted here for clarity.
ICP-MS Analysis of Isolated Particles
To confirm Pb and Cr in the isolated particles (subjected to Raman microspectroscopy analysis) and determine the molar ratio of Pb:Cr, subsequent analysis was carried out using ICP-MS at NFCC, following the general principles of EAM 4.7 with some necessary adjustments primarily due to the smaller sample mass used in this approach. The particles (∼0.1–0.4 mg) were scraped from the microscope slide using a ceramic knife and placed into an acid-washed plastic microcentrifuge tube. Then 0.4 mL of ultrapure HNO3 was added, the tubes capped and placed in a sonicator heated to 50 °C for three hours. Lead (II) chromate standards were analyzed similarly. No visible particulates remained after heating and the solutions were transferred quantitatively to 15 mL centrifuge tubes, with serial dilutions performed to ensure the analytical solution was within the linear calibration range of the external calibration curve, with approximate dilution factors in the range of 0.9–1.8 × 10⁵ for isolated particles and 3–5 × 10⁷ for lead (II) chromate standards (pure standards required additional ∼100× dilution). An increased dilution factor, when compared to the bulk cinnamon sample analysis, was needed since particles from the microscope slide were preconcentrated using the isolation method described above. The diluted solutions were then analyzed using the analysis procedure outlined in EAM 4.7, with the following modifications: (i) No HCl was used for sample or standard dilution (since Hg was not a target analyte), (ii) no isopropyl alcohol was used for the internal standard (to minimize 40Ar12C interference on
ED-XRF Spectrometry
To optimize this approach for future cinnamon products, use of an ED-XRF spectrometer (Shimadzu EDX-7000) was explored to determine if it could be used in tandem, or as a substitute, for ICP-MS analysis, as ED-XRF requires minimal sample preparation, is not destructive, and is significantly less expensive. External calibration standards were prepared by combining a locally purchased cinnamon control with appropriate amounts of PbCrO4 standard (Standard A) and mixing with a wrist action shaker (Dynal Biotech, now Thermo Fisher, USA). Calibration standards and samples were transferred to an EDX sample cup and sealed with a 0.2 mm polypropylene film (both purchased from Spex SamplePrep, now Cole-Palmer, USA) and packed manually by hand to fill the sample cup three-quarters full, then placed on the autosampler turret for analysis. The conditions for analysis are shown in the supplemental information (Table S2, Supplemental Material).
Results and Discussion
As previously discussed, the various ACFPP samples that spurred this investigation were reported to contain between 2.03 and 3.40 µg/g Pb in one set of samples,
30
between 1.9 and 3.0 µg/g in in a separate second set,
29
and between 1.44 and 6.43 µg/g in a third set.
1
In the third report, by Cataldo and coworkers, an ACFPP product containing cinnamon from Manufacturer A was determined to contain 2.18 µg/g Pb and 0.59 µg/g Cr. This study determined (
The equivalent concentration (w/w) of lead (II) chromate based on Pb concentrations are 7970 µg/g and 3550 µg/g for cinnamon Samples A and B, respectively, which is equivalent to 0.80% and 0.35% w/w of lead (II) chromate in the cinnamon. These levels are similar and slightly below detection limits reported by Erasmus and coworkers, 9 who used multiple techniques, including Raman and FT-IR, with principal component analysis to reach detection limits near 0.5% w/w (5000 µg/g). As it is difficult to directly compare the data from that study to this one, Raman spectra of individual particles of lead (II) chromate were obtained using the 3500 µg/g lead (II) chromate sample (Cinnamon Sample B). We estimate our work represents a slight improvement in detection limit due to the preconcentration technique. However, additional work would be needed to determine if this is the case.
Lead (II) chromate occurs in nature as the mineral crocoite. The synthetic form of lead (II) chromate, chrome yellow, is an inorganic pigment used in a variety of applications. The bulk yellow powder is composed of aggregates formed by individual needle-like and anhedral crystals ranging in size from 2–6 µm34,35 (Figure S1, Supplemental Material). Both the natural mineral form of lead (II) chromate (crocoite) and synthetic lead (II) chromate (chrome yellow) exhibit indistinguishable Raman spectra. The strongest peak observed at 839 cm–1 is associated with the CrO4 symmetric stretch. The Raman band profile between 300 and 420 cm–1, with the strongest peak at 358 cm–1, is associated with CrO4 deformations and a lattice vibration is observed at 135 cm–1 (Figure S2, Supplemental Material).9,36,37 Lead (II) chromate does not exhibit any Raman bands above 1300 cm–1. No Raman spectral differences were observed between the three standards of lead (II) chromate.
No obvious free-flowing particles or aggregates of lead (II) chromate were observed in cinnamon Samples A and B using SLM. The bulk cinnamon samples were made up of conglomerates containing various types of particles including cinnamon plant material (Figure S3). The initial Raman analysis of the bulk cinnamon samples focused on analyzing these conglomerates to determine if the lead (II) chromate was located on the surface of the conglomerates or incorporated into the conglomerates themselves. Since the Raman spectra obtained of these conglomerates (using either 638 nm or 785 nm) was dominated by fluorescence associated with the cinnamon plant material and sample heating due to the brown color, no Raman peaks could be observed associated with lead (II) chromate. This indicated that the lead (II) chromate was most likely incorporated in the conglomerates and therefore, further sample cleanup was required to isolate the lead (II) chromate from the cinnamon matrix.
The first sample cleanup process, using DI water, allowed for better isolation of individual particles which potentially contained lead (II) chromate. Using SLM, particles which appeared to contain lead (II) chromate (i.e., yellow in color) were again isolated and Raman spectra collected of each (Figure 2). White arrows in Figures 2b, 2d, and 2f indicate the Raman sampling point for each particle. Raman spectra were collected of the three different particles, and each exhibited the two major Raman peaks associated with lead (II) chromate (839 cm–1 and 358 cm–1) (Figures 2a, 2c, and 2e).

(a) Raman spectrum and (b) photomicrograph of an isolated particle viewed in plane-polarized light with a 100× objective. (c) Raman spectrum and (d) photomicrograph of a second isolated particle viewed in plane-polarized light with a 100× objective. (e) Raman spectrum and (f) photomicrograph of a third isolated particle viewed in plane-polarized light with a 100× objective. Raman spectra normalized for comparison purposes. Photomicrograph scale bars = 4 µm. Spectra obtained from water dispersal method.
Although the two major Raman peaks associated with lead (II) chromate were observed in particles isolated using the water dispersal method, interference from the cinnamon material was still present. This indicated that the lead (II) chromate was somehow incorporated into the cinnamon matrix and explained why the lead (II) chromate itself was not easily observed using SLM or analyzed in the bulk cinnamon powder using Raman spectroscopy. It also indicated that the lead (II) chromate had not simply been added to the bulk cinnamon powder.
The second sample cleanup procedure involved using the density separation method. Unlike the water dispersal method, the density separation method allowed better concentration and physical separation of lead (II) chromate from the cinnamon matrix. Figure S4 (Supplemental Material) shows an example of two different aggregate particles of lead (II) chromate isolated from bulk cinnamon. Unlike the particles previously isolated (Figure 2), these particles appeared to be more representative in color of lead (II) chromate (Figure S1a) and free of cinnamon matrix material. The Raman spectra obtained of the individual particles from Figure S4 exhibited the two major Raman peaks associated with lead (II) chromate (Figure 3). Since these particles appeared to be free of the cinnamon matrix, the Raman spectra obtained of these individual particles exhibited high signal to noise and resolved peaks associated with lead (II) chromate. This included all the CrO4 deformation peaks between 350–450 cm–1 and a lattice vibration observed at 135 cm–1.

(a) Raman spectrum of a particle (b) photomicrograph of particle shown in figure S4a (Supplemental Material) and viewed in plane-polarized light with a 20× objective. (c) Raman spectrum of a particle (d) photomicrograph of particle shown in Figure S4b and viewed in plane-polarized light with a 20× objective. Raman spectra normalized for comparison purposes. Spectra obtained from density separation method.
As shown in Table I, ICP-MS analysis of the isolated particles scraped from the microscope slide from the density separation method resulted in molar ratios of Pb to Cr near 1:1 in both samples as well as the reference standards. These results also agreed with the molar ratio determined from ICP-MS analysis of the bulk cinnamon. This criterion has been cited in multiple publications as an indicator of lead (II) chromate.14,18
Pb and Cr concentrations and molar ratios of Pb to Cr for analyzed samples, compared between bulk sample ICP-MS analysis, bulk sample ED-XRF analysis, and particle isolation (PI) followed by ICP-MS analysis.
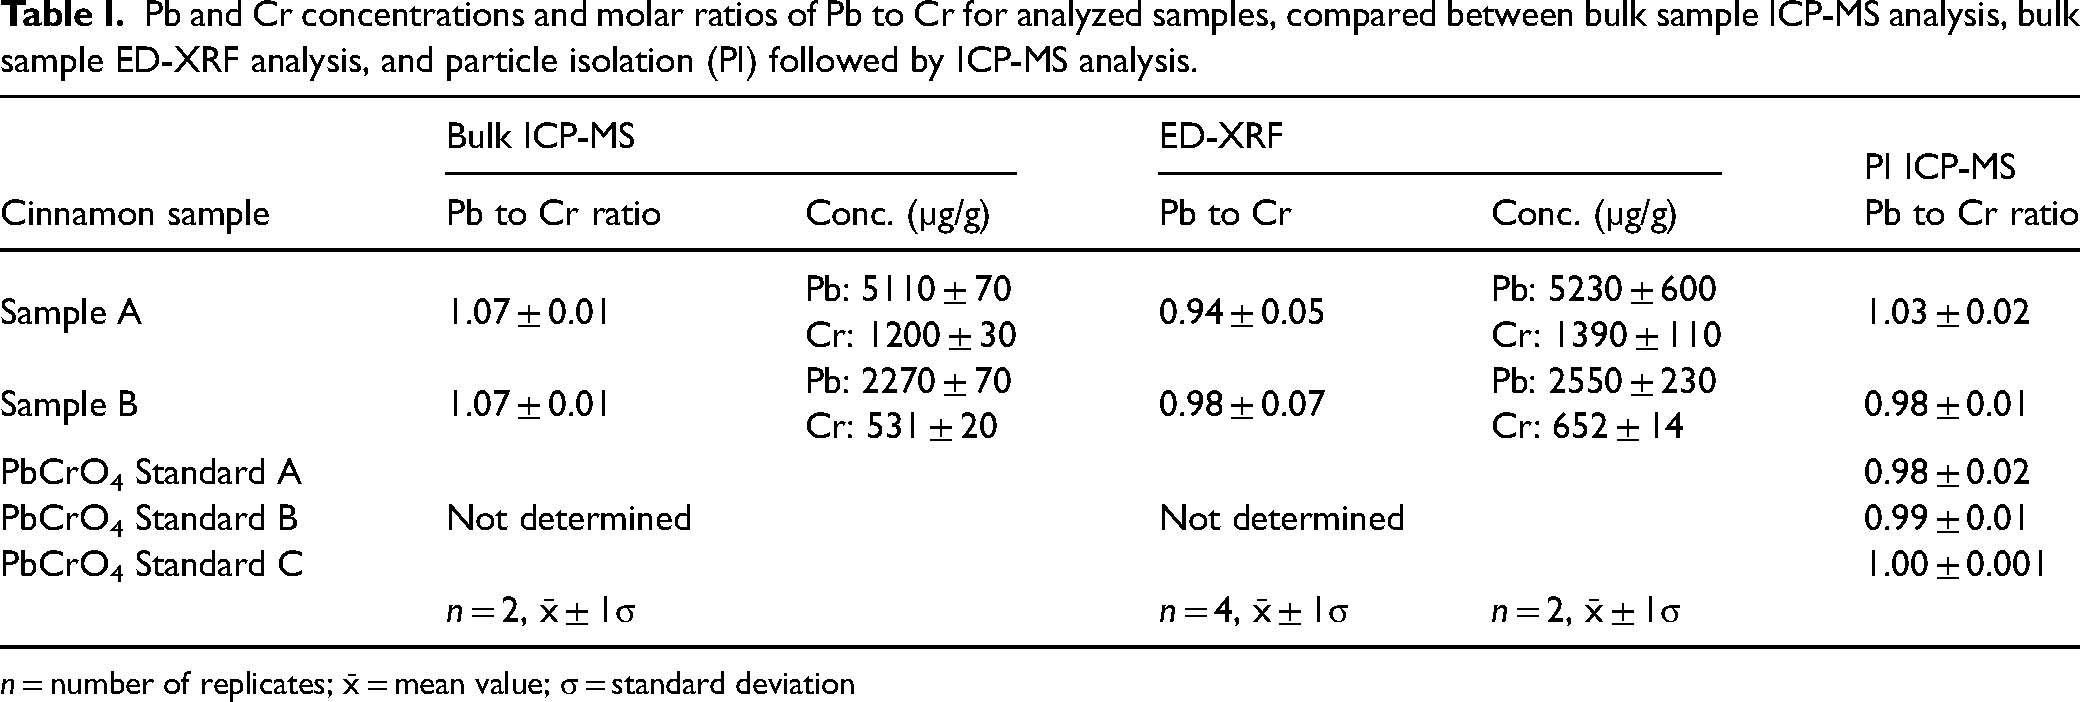
In summary, the Raman results identified lead (II) chromate and both the bulk cinnamon and particle isolation analyses by ICP-MS determined the Pb:Cr ratio to be 1:1, further supporting the presence of lead (II) chromate.
Cinnamon Samples A and B were analyzed by ED-XRF and the concentrations (one preparation, analyzed over four analysis batches, average ± 1σ) of Pb were determined to be 5230 ± 600 µg/g and 2550 ± 230 µg/g and Cr to be 1390 ± 110 µg/g and 652 ± 14 µg/g, respectively. This resulted in molar ratios of Pb:Cr of 0.94 ± 0.05 and 0.98 ± 0.07 for the cinnamon Samples A and B, respectively. When comparing the ED-XRF average concentrations of Pb and Cr to the concentrations determined by bulk ICP-MS analysis, cinnamon Sample A was 102% for Pb and 116% for Cr while Sample B was 112% for Pb and 123% for Cr. Individual replicate results of the ED-XRF analysis are shown in Figure 4 and exhibit a slight positive bias in the ED-XRF results; these results fall within a ± 25% agreement threshold and are therefore considered fit for purpose. Additionally, lead (II) chromate was mixed with flour to evaluate an alternative calibration curve when using a more general organic matrix. This resulted in a slight underestimate for Pb at 78–86% and Cr at 94–98% when compared to the bulk ICP-MS analysis. Therefore, using a generic calibration curve may not be the most effective strategy and matching the matrix seems to be the favorable approach for future analyses. While the ICP-MS results were considered the more accurate of the two analyses, the molar ratios determined by ED-XRF analysis were slightly lower than 1.0 but were within a ratio of 0.9–1.1 and considered equivalent for the purpose of this analysis. These results demonstrate the utility of ED-XRF for analyzing cinnamon samples for Pb and Cr contamination. While additional validation would be required, using ED-XRF as a screening tool would be beneficial and generating accurate quantitative data is plausible. Note that more commonly found levels of Pb and Cr in cinnamon (<5 µg/g) would be near or below the limit of quantitation for most ED-XRF instrumentation.

ED-XRF calibration curves for Pb and Cr created by adding lead (II) chromate to locally purchased cinnamon (black circles). Multiple calibration curves are overlaid to show stability of the analysis over several days. Pb and Cr concentrations from ED-XRF analysis of Cinnamon Samples A and B (green triangles) compared to Pb and Cr concentrations determined using ICP-MS analysis. Note the slight positive bias of ED-XRF results compared to ICP-MS analysis.
Conclusion
The bulk cinnamon materials analyzed in this study contained Pb at levels greater than 1000× higher than typically reported in the literature. Additionally, Cr was correspondingly elevated, and with the molar ratio of Pb:Cr near 1.0, indicating the presence of lead (II) chromate adulteration. Although many literature reports have reported lead (II) chromate as the most likely source for Pb and Cr elevation, to our knowledge none were able to identify the compound. Using a unique particle isolation method and Raman microspectroscopy, we were able to identify lead (II) chromate in two suspect cinnamon samples. Analysis using ICP-MS of the same isolated particles identified Pb and Cr with a Pb:Cr molar ratio consistent with lead (II) chromate. Because no validated compendial method exists for the confirmation of lead (II) chromate in spices, the described novel methodology was used to support the FDA's investigation. This work provides an approach for future analysis of spices suspected of being adulterated. As discussed previously, detection limits will need to be improved to analyze spice samples with Pb and Cr levels in the low part per million range (µg/g). This method was not applied to the ACFPP samples as the reported levels of Cr and Pb were ∼0.5–7 µg/g (∼1000× times lower than in the bulk cinnamon samples analyzed in this study), which would not be detectable by Raman microscopy without significant preconcentration. Finally, the identification of lead (II) chromate and its incorporation in the suspect cinnamon samples implies that environmental contamination was not the cause of the elevated levels of Pb and Cr in the sample but was intentionally added to the samples in question.
Supplemental Material
sj-docx-1-app-10.1177_27551857261425269 - Supplemental material for Detection of Lead (II) Chromate in Cinnamon
Supplemental material, sj-docx-1-app-10.1177_27551857261425269 for Detection of Lead (II) Chromate in Cinnamon by Kevin Kubachka, Mark Witkowski and Daniel Hurt in Applied Spectroscopy Practica
Footnotes
Acknowledgments
The authors would like to thank Dr. Peter Morton, University of Texas A&M, for supplying us with initial standards of lead (II) chromate on short notice. We would also like to thank Dr. Claudia Martinez Lopez, FDA, for helping to prepare lead (II) chromate standards used for ED-XRF analysis and for her discussions regarding the results. Additionally, the authors would like to acknowledge Dr. Duane Satzger for suggesting the isolation procedure used to preconcentrate lead (II) chromate from the cinnamon matrix. The authors would also like to thank Dr. Angel Parades at the FDA's National Center for Toxicological Research for preliminary scanning electron microscopy with energy-dispersive X-ray spectroscopy analyses.
Declaration of Conflicting Interests
The authors declared no potential conflicts of interest with respect to the research, authorship, and/or publication of this article.
Disclaimer
This manuscript reflects the views of the authors and should not be construed to represent U.S. Food and Drug Administration (FDA) views or policies. Any mention of commercial products, trade names and manufacturers is for clarification only and is not intended as FDA approval, endorsement, or recommendation.
Funding
The authors received no financial support for the research, authorship, and/or publication of this article.
Supplemental Material
All supplemental material mentioned in the text is available in the online version of the journal.
References
Supplementary Material
Please find the following supplemental material available below.
For Open Access articles published under a Creative Commons License, all supplemental material carries the same license as the article it is associated with.
For non-Open Access articles published, all supplemental material carries a non-exclusive license, and permission requests for re-use of supplemental material or any part of supplemental material shall be sent directly to the copyright owner as specified in the copyright notice associated with the article.