
Abstract
Introduction
Several powerful tools for the analysis of gene expression data have been developed. Typically, methods such as hierarchical cluster analysis and principal component analysis focus on the dominating structures in the data and fail to depict alternative features and local behavior. In addition standard clustering techniques based on correlated behavior group genes into non-overlapping clusters, less optimal from a biological point of view as individual genes may take part in different cellular responses. To explore alternative methods to interpret complex gene expression data we recently applied independent component analysis (ICA) (Frigyesi et al. 2006). Even though this method could identify additional substructures in the data compared to standard gene clustering methods, ICA, as well as PCA basis vectors have both positive and negative coefficients. Thus modeling of the original data may involve complex cancellations between positive and negative values. In a gene expression situation negative values contradict physical realities as a gene with a negative expression cannot be readily interpreted; in a biological setting a gene is either present with a variable intensity or it is absent. It therefore makes sense to constrain both the factors and their coefficients to a non-negative setting. One such alternative approach is non-negative matrix factorization (Lee and Seung, 1999) in which data is modeled as the product of two non-negative matrices. Thus NMF reproduces data by only additive combinations of non-negative vectors. Lee and Seung (1999) showed that the basis vectors obtained by NMF when applied to facial images were “non-global” and composed of “natural” parts of the facial images. The non-negativity requirement restricts the basis vectors to be composed of co-activated pixels from the same part of the face. This is attractive from a microarray analysis perspective as such co-activation may be equivalent to expression modules or metagenes. Furthermore, as NMF detects local behavior of variables (genes) this method may detect gene sets that show correlated expression in subsets of tumors but not in others, patterns that would be undetected by approaches based on global gene behavior. Kim and Tidor (2003) applied NMF to 300 yeast whole genome expression analyses and could show that the obtained basis vectors were stable and that vectors could be annotated by MIPS functional categories. Several modifications of the original NMF algorithm have been presented (Brunet et al. 2004; Gao and Church, 2005; Carmona-Saez et al. 2006; Wang et al. 2006; Fogel et al. 2007, Kim and Park, 2007). In the present investigation we evaluate NMF as a tool to retrieve significant biological information from complex microarray data and focus on the biological interpretation of the metagenes thus obtained. We show that several obtained metagenes correlates with tumor subtypes and tumors with characteristic chromosomal translocations, indicating that metagenes may correspond to specific disease entities. Hence, NMF extracts biological relevant structures of microarray expression data and may thus contribute to a deeper understanding of tumor behavior.
Materials and Methods
Data Sets
The CNS data (Pomeroy et al. 2002) was downloaded from supporting information to Pomeroy et al. (2002) to contain 34 cases; 4 normal cerebella (Ncer), 10 medulloblastoma (MD), 10 malignant glioma (Mglio), 10 Rhabdoid tumor (Rhab), and 6759 genes/reporters. The data was normalized using the first sample as a reference, i.e. dividing all samples with this reference sample, and the obtained quotients log-transformed. The AML dataset described by Bullinger et al. (2004) was downloaded from the Gene Expression Omnibus (http://www.ncbi.nlm.nih.gov/geo/, accession number GSE425) to contain 6283 genes/reporters. Pretreatment and filtering of the data were as in (Frigyesi et al. 2006). The final data set included 4651 genes and 108 cases. The head and neck squamous cell carcinoma data set described by Chung et al. (2004) was downloaded from the Gene Expression Omnibus (http://www.ncbi.nlm.nih.gov/geo/, accession number GSE686). Pretreatment and filtering of the data were as in (Frigyesi et al. 2006). The resulting data comprised 8620 genes and 53 cases. The time series data described by Chang et al. (2004) and the lung cancer data set described by Garber et al. (2001) were downloaded from the Stanford Microarray Database (http://www.smd.stanford.edu/index.shtml). Reporters for identical genes were merged and genes with at least 80% values were selected and corrected for missing values by KNN imputation using K=12 (in the case of lung cancer data) resulting in a dataset of 568 genes and 16 time points for the time series data and 5135 genes and 53 cases for the lung cancer data.
Non-Negative Matrix Factorization(Nmf)
We assume that our gene expression (microarray) data is in the form of a matrix
As the NMF finds different solutions for different initial conditions, the factorizations were repeated 100 times using the previously determined rank and evaluated according to their

Rank estimates. a) The time series data, b) log transformed CNS data, c) log transformed leukemia data, d) raw ratio leukemia data, e) log transformed lung cancer data, f) raw ratio lung cancer data, g) log transformed HNSCC data, h) raw ratio HNSCC data. The blue line is the residual error (RE) for data whilst the red line is the residual error for the same data with the genes permuted (different permutations for each sample).
Association of Metagenes with Tumor Subtypes
We used Kruskal-Wallis’ test (a non-parametric analogue to ANOVA and an extension of the Mann-Whitney test to more than two groups) to test for difference of medians for different tumour subtypes of the metagenes. Multiple testing was corrected for by using the Holm-Bonferroni method. The results are presented as box-plots with notches that display the variability of the median between tumor subtypes. The width of a notch is computed so that box plots width notches that do not overlap have different medians at the 5% significance level.
Consensus Reordering Matrices
In Brunet et al. (2004) it is assumed that factoring with rank
Biological Interpretations of Metagenes
To assign genes to metagenes the weights on the W matrices were ranked and a weight threshold selected to produce on average 100 genes per metagene. This approach identifies genes that contribute the most to the original features of the data and ensures that the selected genes have a strong influence on the respective metagenes. We used two methods for biological interpretations, GO term analysis using the EASE software (Douglas et al. 2003) and gene set enrichment analysis using the GSEA software (Subramanian et al. 2005). EASE identifies significant enrichment of specific gene ontology (GO) categories in a given list of genes compared to the total list of genes. Gene symbols were used in the analyses and the top ranking genes in the respective metagens were compared with total content of genes with names remaining after the initial filtering. Multiple testing was corrected for by using the step-down Bonferroni multiplicity function supplied by the EASE software. The step-down Bonferroni correction ranks the results by the statistic in ascending order. Each value is ten multiplied by (n-rank) where n is the number of results. Corrected p-values <0.05 calculated using EASE statistics were considered significant. GSEA uses a ranked gene list as an input and calculates an enrichment score to determine to what extent a predefined gene-set is overrepresented at the extremes of the entire list. Genes were ranked according to the weights in the respective basis vectors and used as an input to a gene set enrichment analysis. We used the gene sets made available within the GSEA software. The significance of the obtained enrichments scores is estimated by a permutation test and adjusted for multiple testing. We used 1000 permutations to estimate p-values and false discovery rates. The GSEA approach is independent of any arbitrarily selected threshold to assign genes to metagenes.
Results
We estimated the rank
Time Series Data
We calculated the

Temporal profiles for the 5 metagenes obtained from the time series data compared with temporal profiles for gene clusters obtained by a K-means 5 cluster solution. Metagenes (MG) and K-means clusters (KMC) arranged and named according to their temporal expression. To be able to compare the K-means cluster and H matrix profiles their respective values normalized across the time points and expressed in standard deviations (SD).
Cns Tumors
We calculated the

Cophenetic correlation coefficients for hierarchically clustered a) CNS, b) leukemia, and c) lung cancer samples. The samples were clustered using average linkage and 1-correlation as distance.

A reordered consensus matrix from a four-cluster solution of the CNS cases. The samples were clustered using average linkage and 1-correlation as distances. Deep-red color indicates perfect agreement of the solutions, whilst blue color indicates no agreement.
Leukemia Data
We Calculated the
GO category analysis of leukemia metagenes.

Only metagenes with significant enrichment of GO categories listed.
Only the top three GO categories are listed.
Step-down Bonferroni corrected EASE scores.
Using Kruskal-Wallis’ test and the Holm-Bonferroni method for correction of multiple tests we found that metagenes 4, 7, 9, 11, 12, 14, 15, 25 and 28 differed (p < 0.05) in their expression levels for t(15; 17), t(8; 21), del(7q)/-7, t(9; 11) and inv(16) tumors. Post hoc analyses using Mann-Whitney's test revealed that MG7 showed significantly (p < 0.05) higher weights in inv(16) tumors, MG11 in t(8; 21), MG14 in t(15; 17), and MG25 in t(9; 11) tumors (Supplementary Fig. 4). In addition, del(7q)/-7 tumors showed significantly (p < 0.05) lower weights for MG12. To further evaluate the MG7, 14, 11 and 25 metagenes, the genes were ranked according to

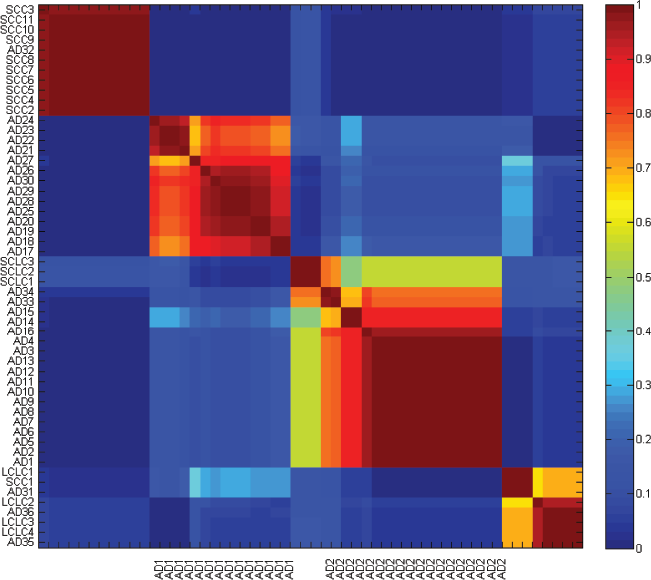
Reordered consensus matrix for a five-cluster-solutions of the leukemia data. The samples were clustered using average linkage and 1-correlation as distance. Deep-red color indicates perfect agreement of the solutions, whilst blue color indicates no agreement.
Lung Cancer Data
The
GO category analysis of lung cancer metagenes.

Only the top three GO categories are listed.
Step down Bonferroni corrected EASE scores.
Only related gene sets are listed.
FDR estimated using permutation tests included in the GSEA software.
Reordered consensus matrix for a four-cluster-solutions of the lung cancer data. The samples were clustered using average linkage and 1-correlation as distances. Deep-red color indicates perfect agreement of the solutions, whilst blue color indicates no agreement.
Discussion
We have evaluated the NMF algorithm as a tool to reveal biologically relevant features in complex gene expression data. NMF is a relatively new approach for gene expression analysis and no consensus procedure has as yet emerged. One issue is the use of a sparseness function as a part of the updating rules in the NMF algorithm. In essence, sparseness reduces the number of units that effectively are used to represent the data vectors and hence the number genes assigned to each metagene. Motivations for introducing sparseness as a part of the updating rules includes that all genes analyzed within in an experiment are unlikely to contribute to a specific process (Fogel et al. 2007), and that NMF without sparseness may not always yield parts based representations (Hoyer, 2004). Even if sparseness may be motivated in some situations (Gao and Curch, 2005) a side effect is that biological data of potential importance may be lost in the process. Hence, including a sparseness function in the updating rules may force the results into a biologically over-simplified model. In the present investigation we chose not to include sparseness in the updating rules and to assign genes to metagenes by an
A feature of the NMF algorithm is that only positive values are allowed in the input matrix and hence one approach would be to use raw ratios. The use of log transformation is however motivated as the relative gene expression changes, expressed as fold changes, are more likely to be of biological significance than absolute changes. In addition, raw ratios emphasize changes in the expression of high-ratio genes at the expense of changes in low-ratio genes, with a skewed influence of the factorization process as a consequence. To avoid this effect, and to equalize the scale with respect to fold changes, we transformed the log values in the input matrix to positive values by adding the absolute value of the lowest log ratio to all ratios. A possible indication that this type of data transformation may be advantageous was seen in the estimations of rank. Here we applied a modified version if the approach suggested by Kim and Tidor (2003) in which factorization solutions with increasing ranks are compared with factorizations of the equivalent randomized data. In our hands the results obtained with log transformed data were more readily interpreted than the non-transformed data.
In addition to estimate the appropriate number of dimensions, the rank estimation plots may be used to evaluate to what extent NMF captures significant structure in the data. This is an important issue as most algorithms will produce results with randomized data. The residual error graphs showed a sharp decrease in error when analyzing the original CNS, time series, leukemia, and lung cancer data compared with the slopes of the randomized data. This was in contrast to the similar slopes of the HNSCC data and the randomized HNSCC data. This is in line with the fact that CNS, leukemia, and lung cancers are defined by distinct histological subtypes whereas the HNSCC data represent a group of more homogeneous and also highly advanced tumors. However, and irrespective of the cause, the rank estimation plot for HNSCC clearly shows that NMF is not applicable to this dataset.
In Brunet et al. (2004) it is assumed that factoring with
The analysis of the time series data gave at hand that the metagenes behaved similarly across the time points as gene clusters defined by global correlation. In this comparison we applied K-means clustering as the numbers of clusters may be pre-defined used in this algorithm, and hence a NMF solution with rank five could be directly compared with a five cluster K-means model. Both approaches assigned genes with strong enrichment for the GO category cell cycle to the last cluster/metagene. Hence, in the relatively short time series experiment analyzed, the NMF algorithm extracts essentially the same information as methods based on global correlations.
The GO analysis of the leukemia metagenes identified 12 out of 30 with significant enrichment for GO categories. Several metagenes were significant for the same GO categories indicating that metagenes may represent different aspects of the same cellular processes or components. Indeed, the tentative analysis of two of the four leukemia metagenes significant for defense/immune response showed that they represented different parts of the defense/immune response system. The analysis of the same data using global correlation detects one single cluster related to defense/immune response GO categories (Frigyesi et al. 2006). Similarly, the metagenes associated with lung cancer, MG7 and MG13, both affected the extra cellular compartment whereas MG7 influenced cell-cell contact and M13 influenced cell-cell signaling. This shows that NMF reveals biologically significant structures at a higher resolution than standard algorithms. More importantly, specific metagenes could be assigned to clinically relevant tumors subtypes. In the CNS data the four classes of samples, MD, MGlio, Rhab, and Ncer showed strong correlation with individual metagenes. In the leukemia dataset metagenes were found specific for the inv(16), t(8; 21), t(15; 17), and the t(9; 11) subtypes. This association was further validated by the GSEA analysis that showed enrichment for independent gene sets associated with
Even though the NMF algorithm has been shown to perform excellently and shown to identify biologically meaningful structures at high resolution, the biological correlate of the obtained metagenes may be uncertain. It would be tempting to interpret metagenes as stable expression modules regulated by some common factors. However, as NMF produces the best solution for a given rank the composition of the basis vectors varies with rank. This is in contrast to PCA and ICA were the nature of the factors is independent of the number of dimensions (rank) chosen. However, this effect will most likely only be a challenge when working with a low number of dimensions as a change in rank will have a proportionally larger impact in these situations.
We have shown that NMF extracts biological relevant structures at high resolution in expression microarray data. Particularly, metagenes enriched for the same GO categories were shown to affect different aspects of the same biological processes. Hence, the use of NMF may contribute to a deeper understanding of tumorigenesis and tumor behavior. Several of the obtained metagenes were associated with specific tumor subtypes indicating that metagenes may constitute disease specific entities and thus that NMF may be an attractive tool for disease classification. Indeed, in a recent publication (Tamayo et al. 2007) NMF was used to extract platform independent metagens that was shown to outperform standard algorithms for classification of leukemia subtypes. Taken together NMF may be a useful approach both for interpretation of biological data and for disease classification.